Free Access
Fig. 11.
Download original image
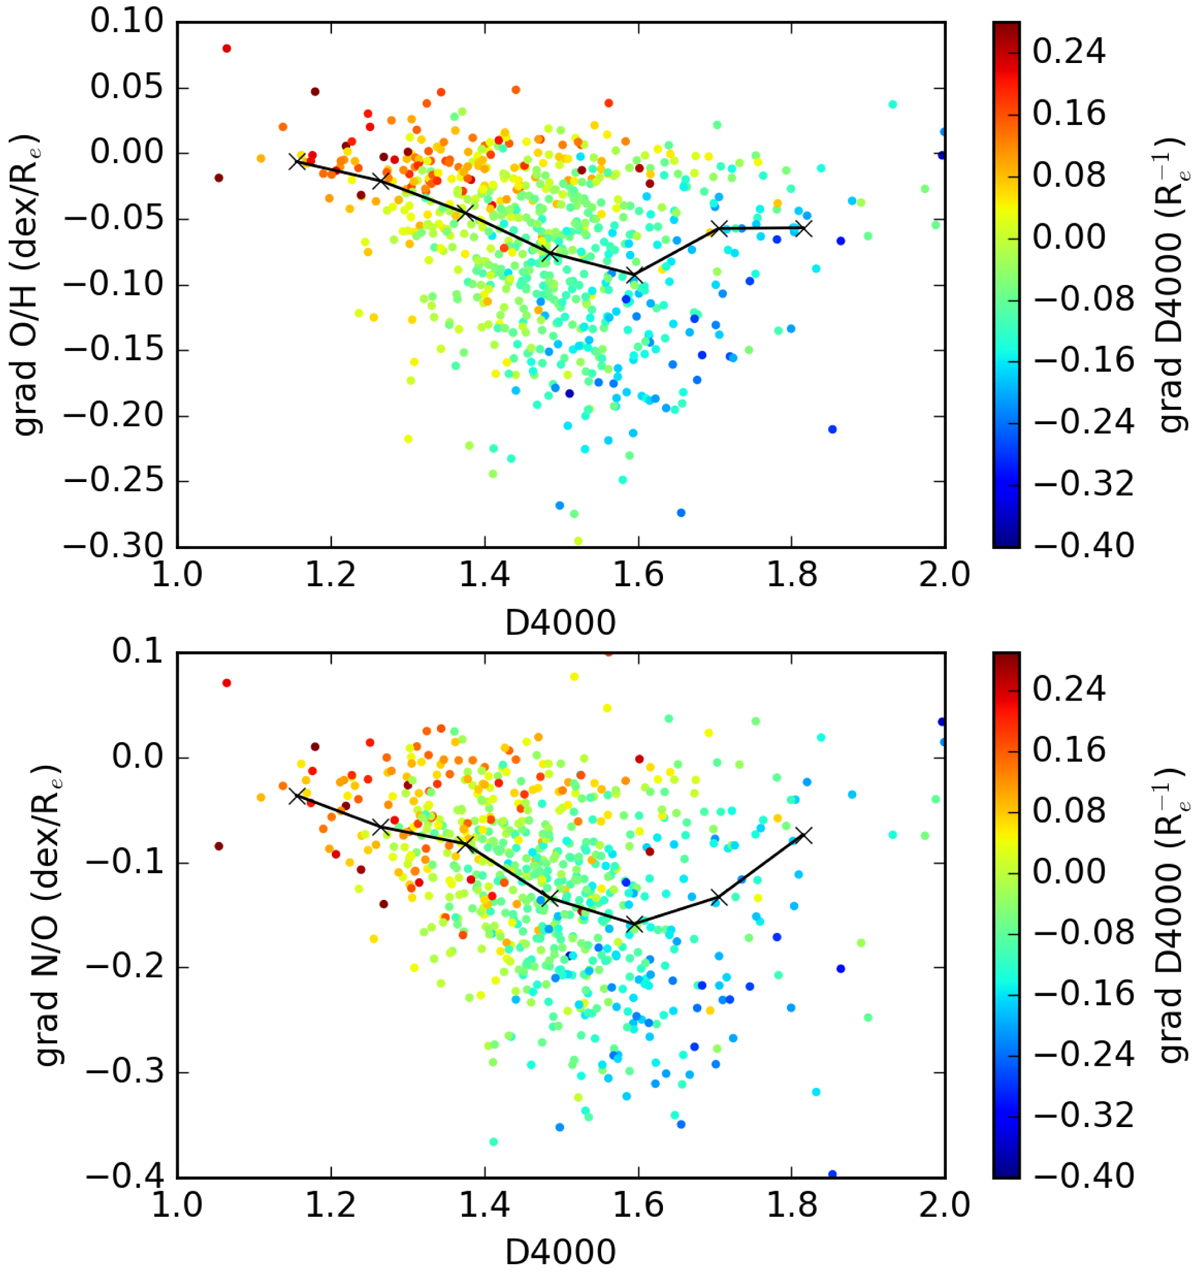
O/H gradient (top panel) and N/O gradient (bottom panel) as a function of the D(4000) index with colour-coded gradient of D(4000) for abundances derived from the R calibration (see the text for details). Crosses connected by solid lines present median abundance gradient values in each bin of D(4000).
Current usage metrics show cumulative count of Article Views (full-text article views including HTML views, PDF and ePub downloads, according to the available data) and Abstracts Views on Vision4Press platform.
Data correspond to usage on the plateform after 2015. The current usage metrics is available 48-96 hours after online publication and is updated daily on week days.
Initial download of the metrics may take a while.