Fig. 1.
Download original image
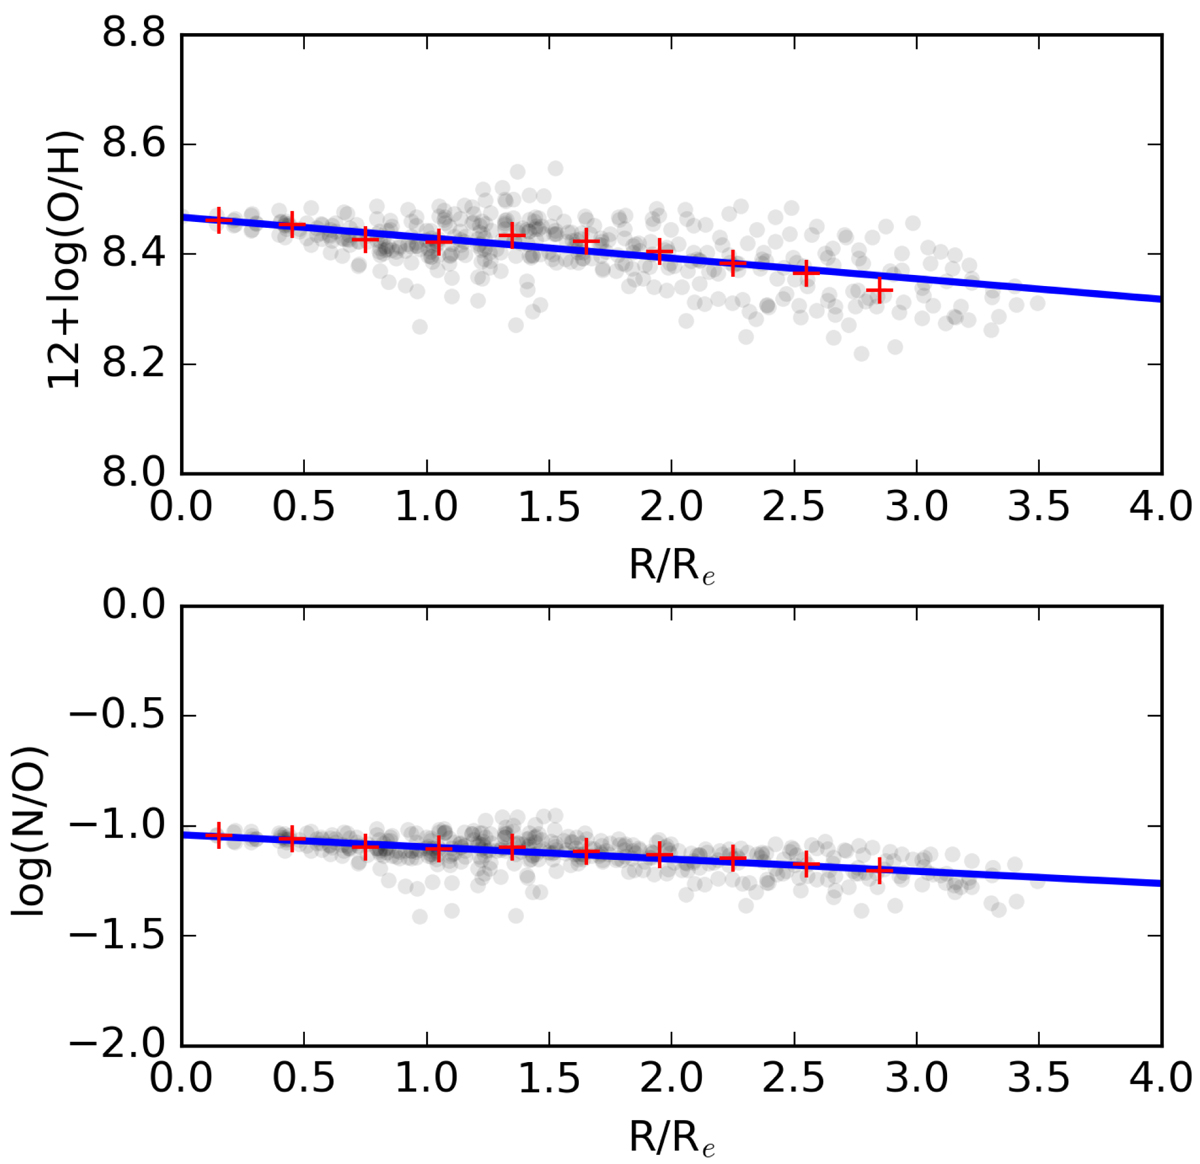
Example of the radial gradients of O/H (upper panel) and N/O (lower panel) in the MaNGA galaxy 1-48157 using data from data cube 10001-12701. Grey points are values in each spaxel, derived from the empirical R calibration of Pilyugin & Grebel (2016). Red crosses are median values in bins. A solid line is the linear fit to the data.
Current usage metrics show cumulative count of Article Views (full-text article views including HTML views, PDF and ePub downloads, according to the available data) and Abstracts Views on Vision4Press platform.
Data correspond to usage on the plateform after 2015. The current usage metrics is available 48-96 hours after online publication and is updated daily on week days.
Initial download of the metrics may take a while.