Fig. 8.
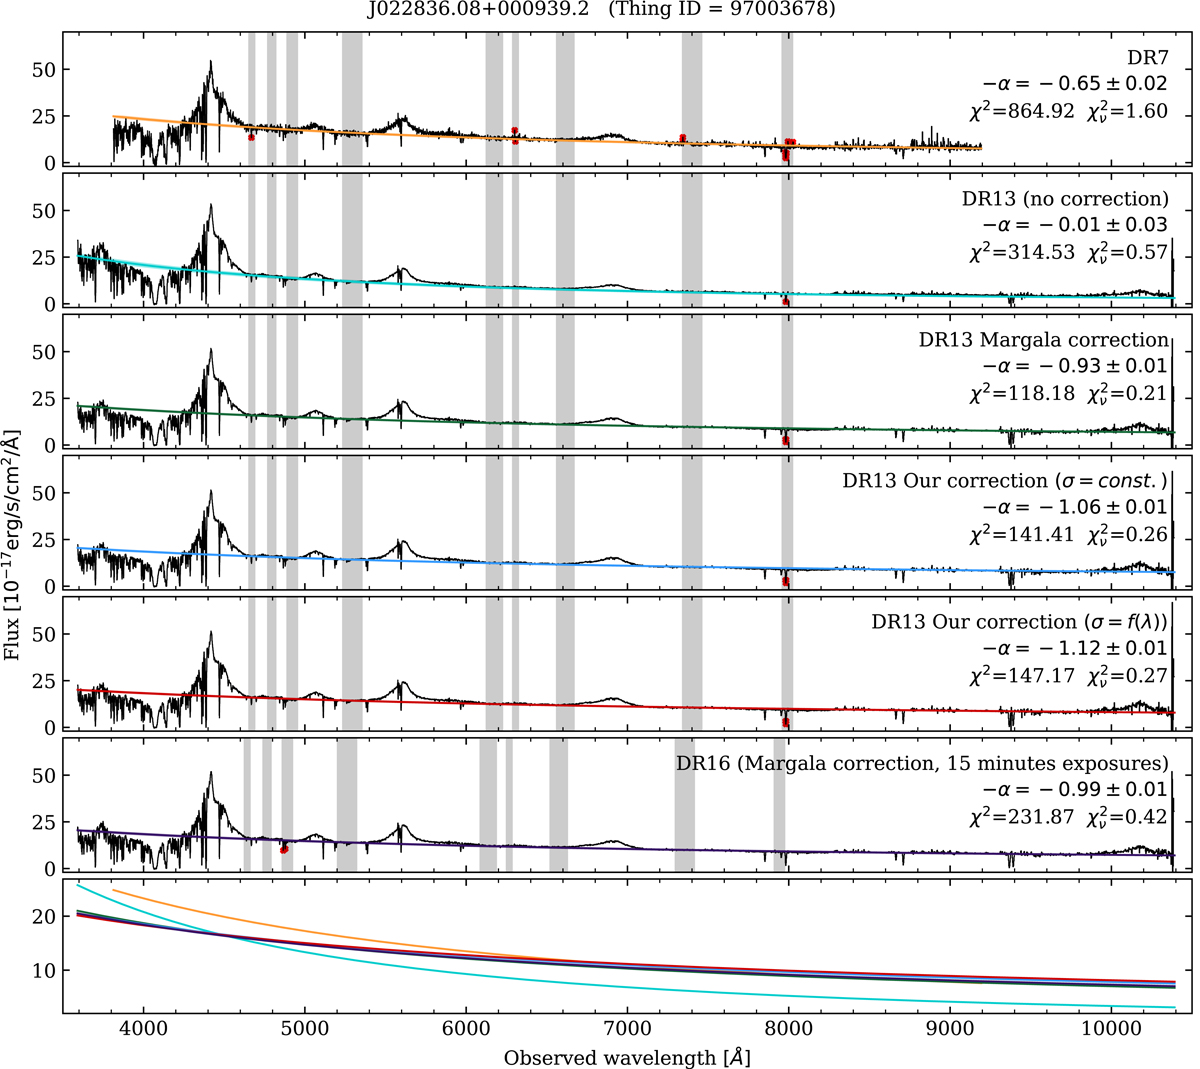
Download original image
Summed spectrum of the quasar J022836.08+000939.2 (black line). Top panel: DR7 spectrum. The five spectra below the top panel are the same spectral data but corrected in different ways. The continuous coloured line in each panel shows the best-fit power-law continuum to that spectrum, for different flux correction models. The text in each box shows the fitted spectral index and the best-fit χ2 (and its normalised value). The grey shaded areas illustrate the fitting regions. The red dots indicate pixels removed during the power-law fitting procedure. See Sect. 4.2 for details. The six spectral panels all show that a single power law fits well. Lowest panel: six correction functions in slightly more detail.
Current usage metrics show cumulative count of Article Views (full-text article views including HTML views, PDF and ePub downloads, according to the available data) and Abstracts Views on Vision4Press platform.
Data correspond to usage on the plateform after 2015. The current usage metrics is available 48-96 hours after online publication and is updated daily on week days.
Initial download of the metrics may take a while.