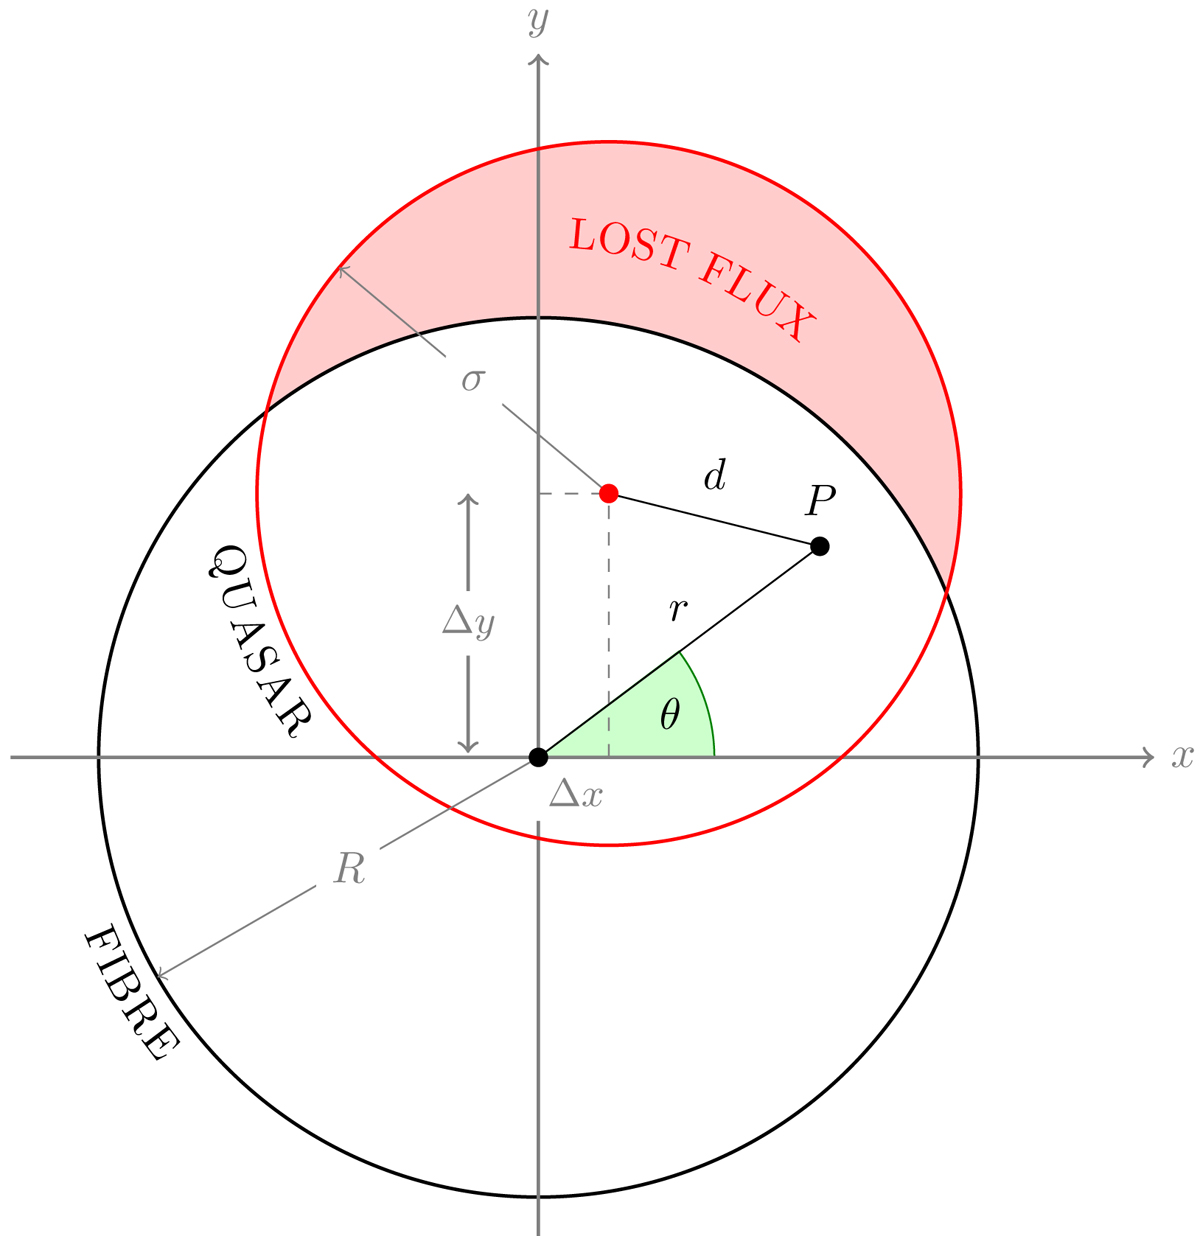
Fig. 2.
Download original image
Fibre and seeing profiles in the plane of the detector. The y-axis is aligned with increasing altitude. The black circle represents the fibre with a radius R. The red dot and circle represent the quasar position and profile; i.e. the σ of the quasar Gaussian seeing profile. The red shaded area illustrates the light lost. To calculate the captured flux, we integrate the normalised quasar light intensity within the fibre radius. The figure is adapted from Barnes & Walsh (1988).
Current usage metrics show cumulative count of Article Views (full-text article views including HTML views, PDF and ePub downloads, according to the available data) and Abstracts Views on Vision4Press platform.
Data correspond to usage on the plateform after 2015. The current usage metrics is available 48-96 hours after online publication and is updated daily on week days.
Initial download of the metrics may take a while.