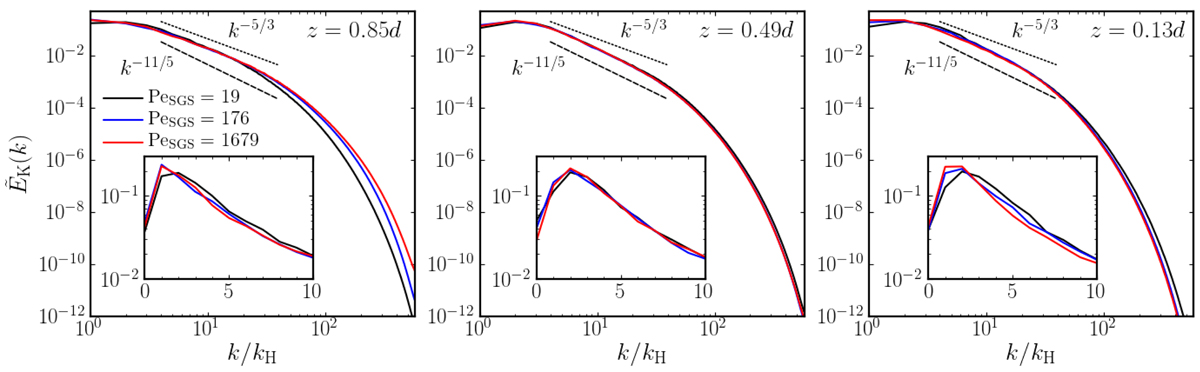
Fig. 8.
Download original image
Normalised power spectra of velocity from depths z = 0.85d (left panel), z = 0.49d (middle), and z = 0.13d (right) for PrSGS = 0.1 (black lines), 1 (blue), and 10 (red) and Re = 167…190 corresponding to runs C01, C1, and C10, respectively. The insets show the low-wavenumber part of the spectra. The dashed and dotted lines respectively indicate the Bolgiano-Obukhov k−11/5 and Kolmogorov-Obukhov k−5/3 scalings for reference.
Current usage metrics show cumulative count of Article Views (full-text article views including HTML views, PDF and ePub downloads, according to the available data) and Abstracts Views on Vision4Press platform.
Data correspond to usage on the plateform after 2015. The current usage metrics is available 48-96 hours after online publication and is updated daily on week days.
Initial download of the metrics may take a while.