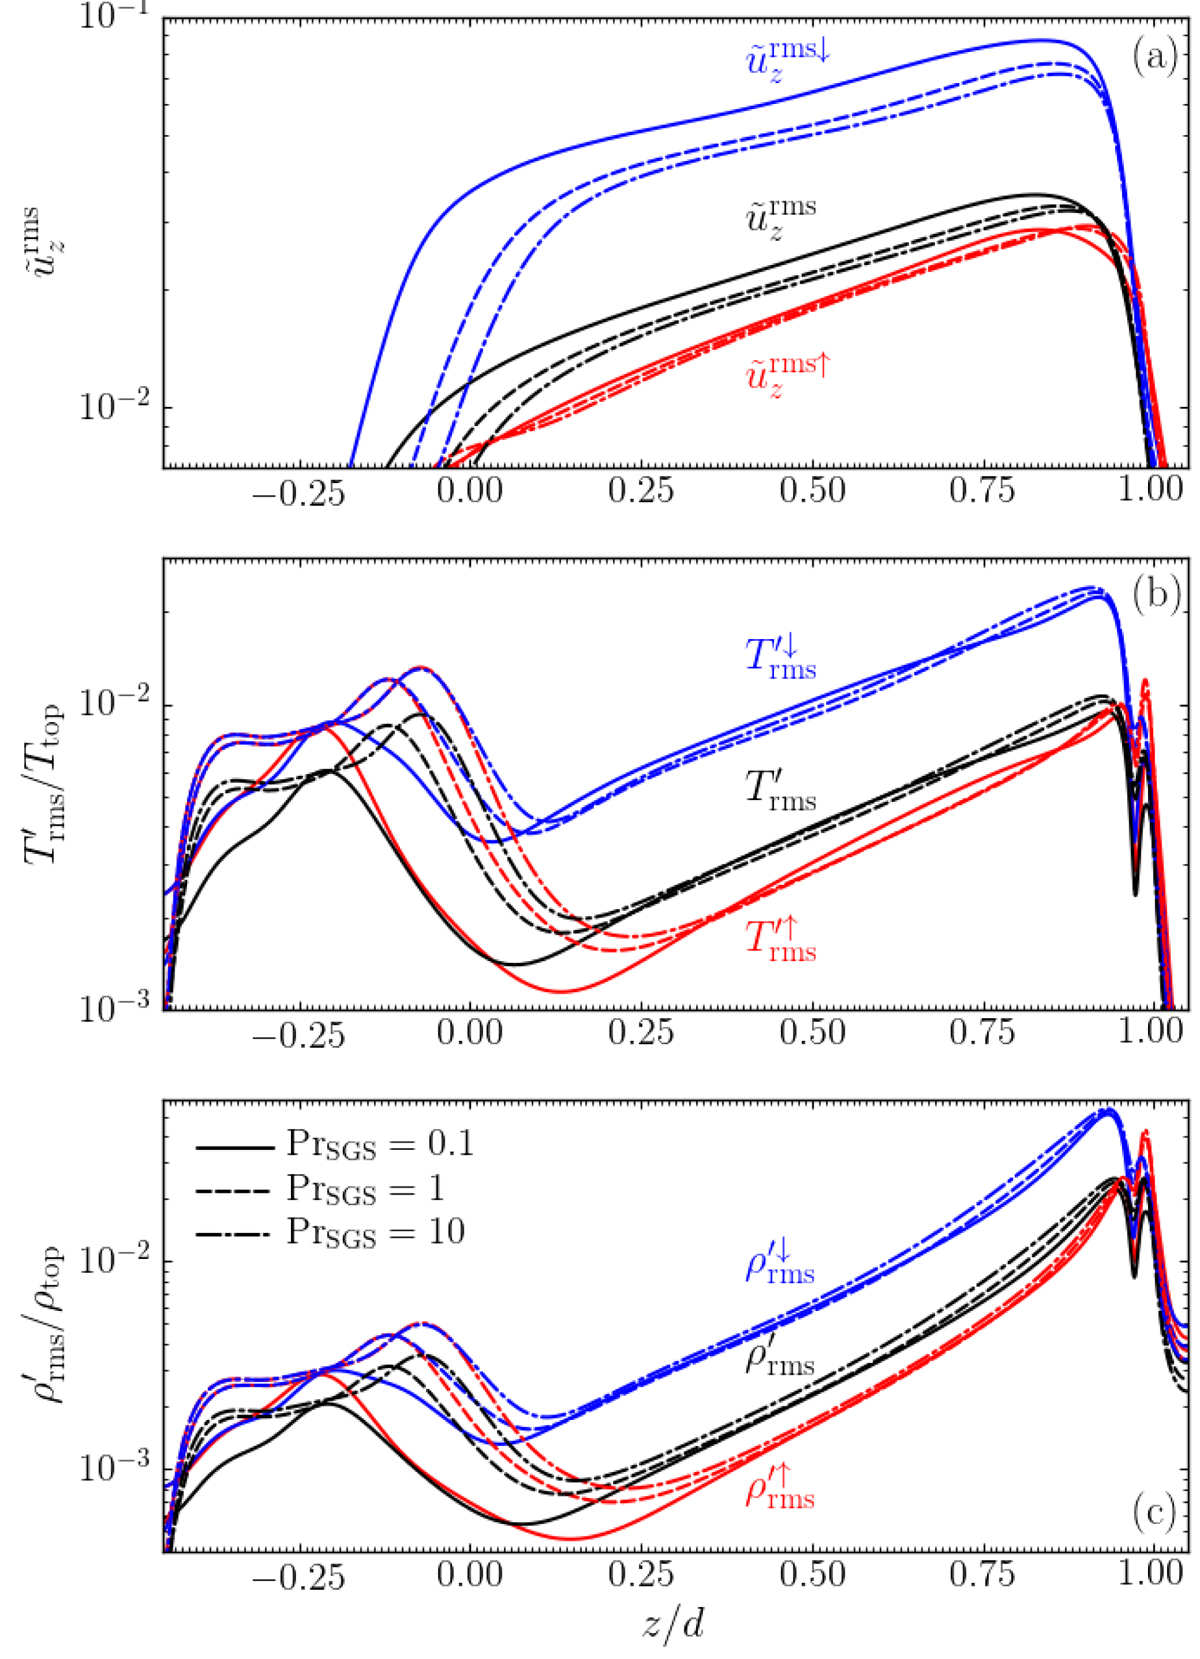
Fig. 18.
Download original image
Horizontally averaged total rms vertical velocity (black lines) and the contributions from upflows (red) and downflows (blue) (a). Corresponding rms temperature (b) and density (c) fluctuations normalised by Ttop and ρtop = ρ0, respectively. Data for runs C01, C1, and C10 with PrSGS = 0.1, 1, and 10 are shown as indicated by the legend.
Current usage metrics show cumulative count of Article Views (full-text article views including HTML views, PDF and ePub downloads, according to the available data) and Abstracts Views on Vision4Press platform.
Data correspond to usage on the plateform after 2015. The current usage metrics is available 48-96 hours after online publication and is updated daily on week days.
Initial download of the metrics may take a while.