Open Access
Fig. 1.
Download original image
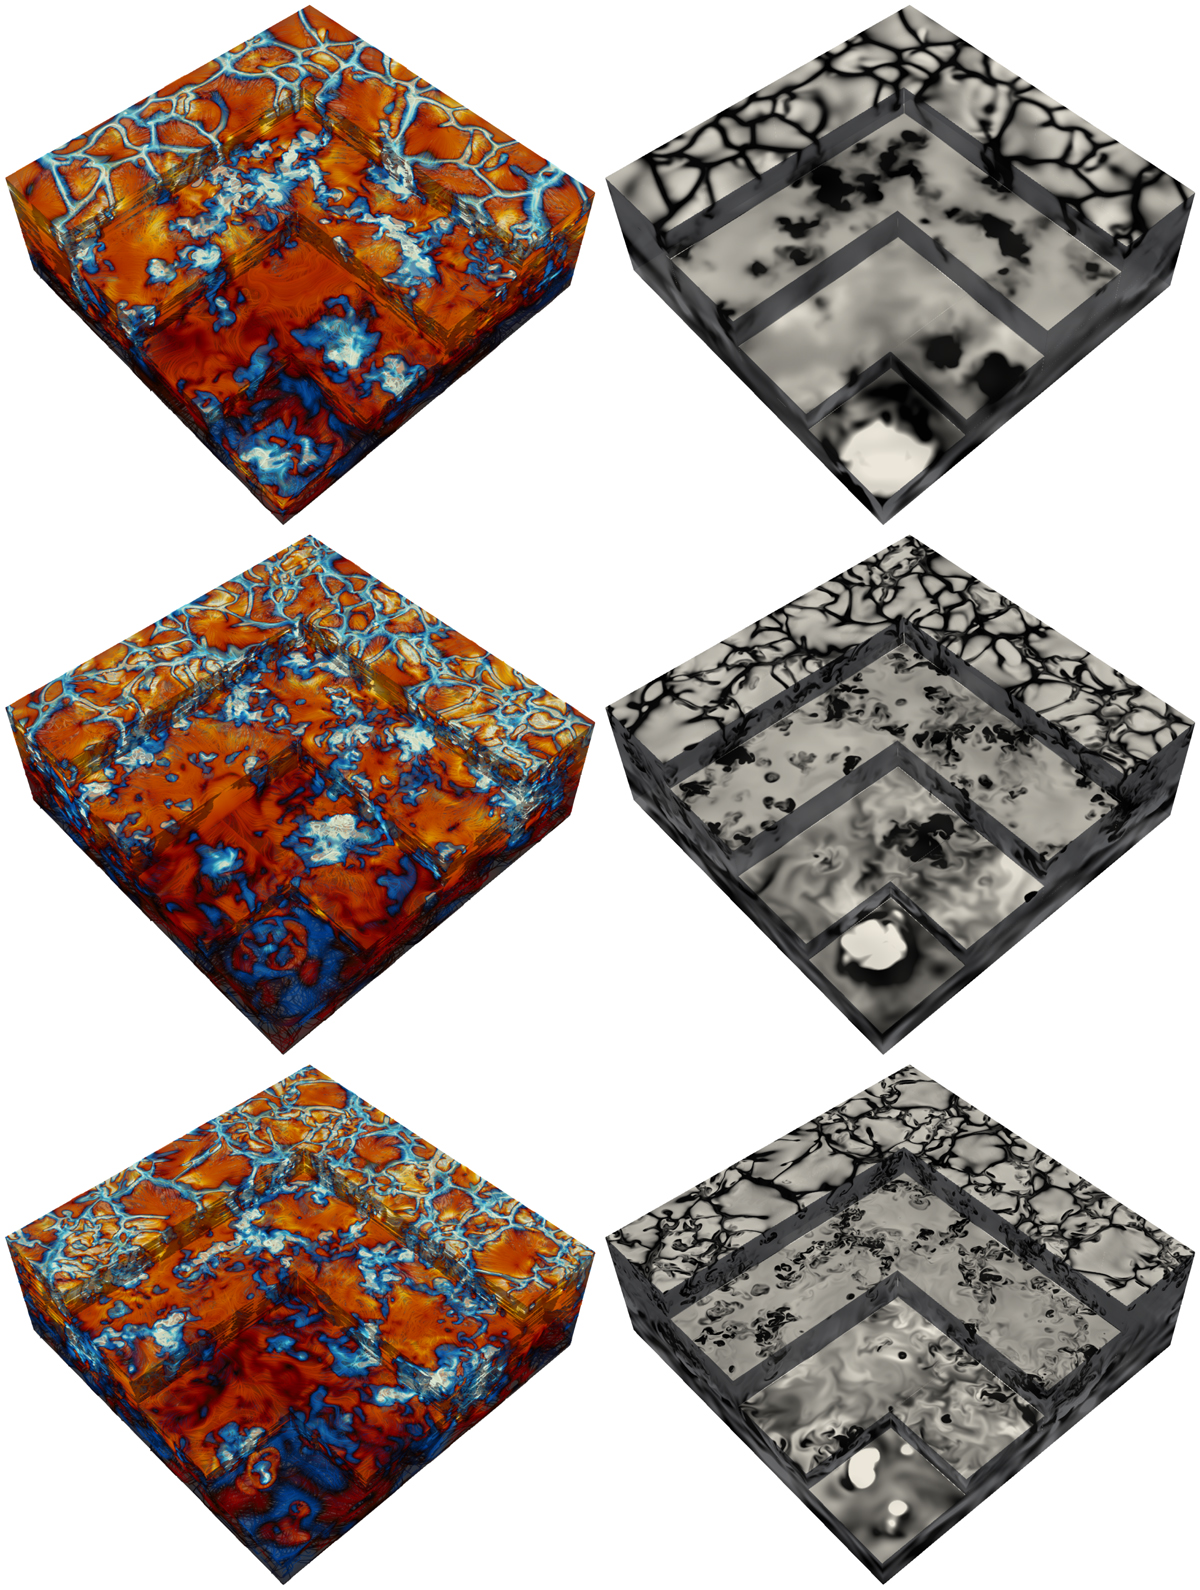
Left panels: normalised vertical velocity ![]() (colour contours) and streamlines of the flow from runs C01 (PrSGS = 0.1, top panel), C1 (PrSGS = 1, middle), and C10 (PrSGS = 10, bottom). The colours of the streamlines indicate the local vertical velocity. Right panels: normalised entropy fluctuations
(colour contours) and streamlines of the flow from runs C01 (PrSGS = 0.1, top panel), C1 (PrSGS = 1, middle), and C10 (PrSGS = 10, bottom). The colours of the streamlines indicate the local vertical velocity. Right panels: normalised entropy fluctuations ![]() from the same runs.
from the same runs.
Current usage metrics show cumulative count of Article Views (full-text article views including HTML views, PDF and ePub downloads, according to the available data) and Abstracts Views on Vision4Press platform.
Data correspond to usage on the plateform after 2015. The current usage metrics is available 48-96 hours after online publication and is updated daily on week days.
Initial download of the metrics may take a while.