Fig. 9.
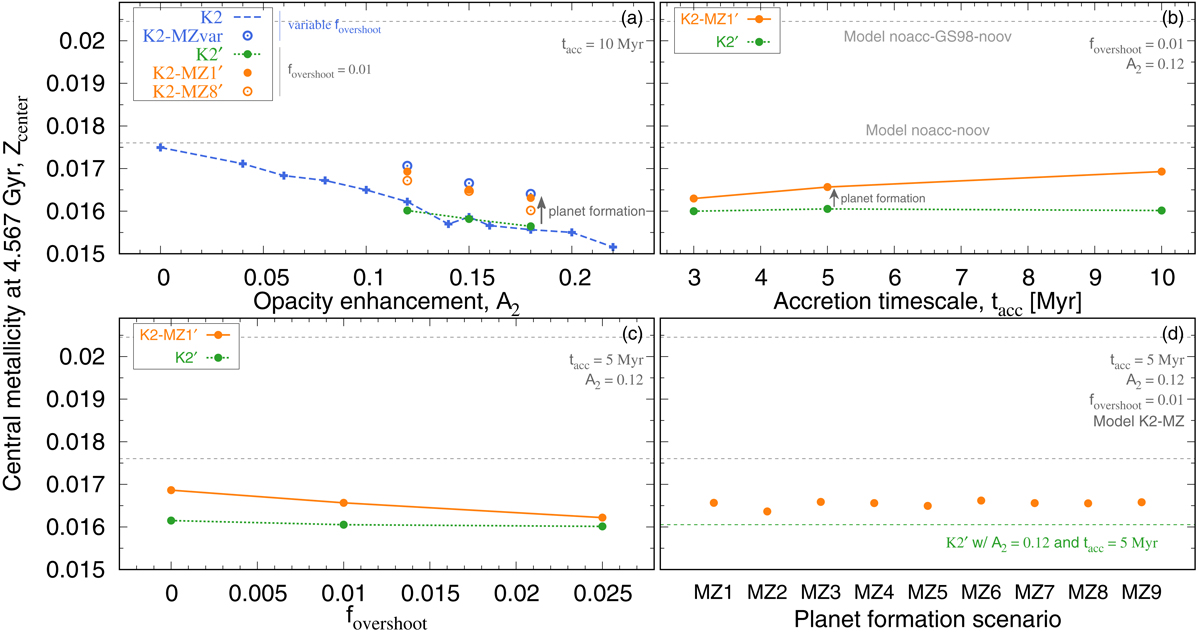
Download original image
Dependence of Zcenter on (a) A2, (b) tacc, (c) fovershoot, and (d) planet formation models (corresponding to different values of M1, M2, and Zacc,max; see Table 4). In panel a, the results of models K2 and K2-MZvar are shown, in addition to those of models K2′, K2-MZ1′, and K2-MZ8′, with fovershoot = 0.01 and tacc = 10 Myr (see Table 1). In panels b and c, the green and orange curves indicate models K2′ and K2-MZ1′, respectively. The orange dots in panel d are the K2-MZ simulation results. The two horizontal gray dashed lines in all the panels denote the results of the non-accreting models without overshooting for the GS98 (top) and AGSS09 (bottom) compositions. The horizontal green dashed line in panel d denotes the result of model K2′ with A2 = 0.12, tacc = 5 Myr, and fovershoot = 0.01.
Current usage metrics show cumulative count of Article Views (full-text article views including HTML views, PDF and ePub downloads, according to the available data) and Abstracts Views on Vision4Press platform.
Data correspond to usage on the plateform after 2015. The current usage metrics is available 48-96 hours after online publication and is updated daily on week days.
Initial download of the metrics may take a while.