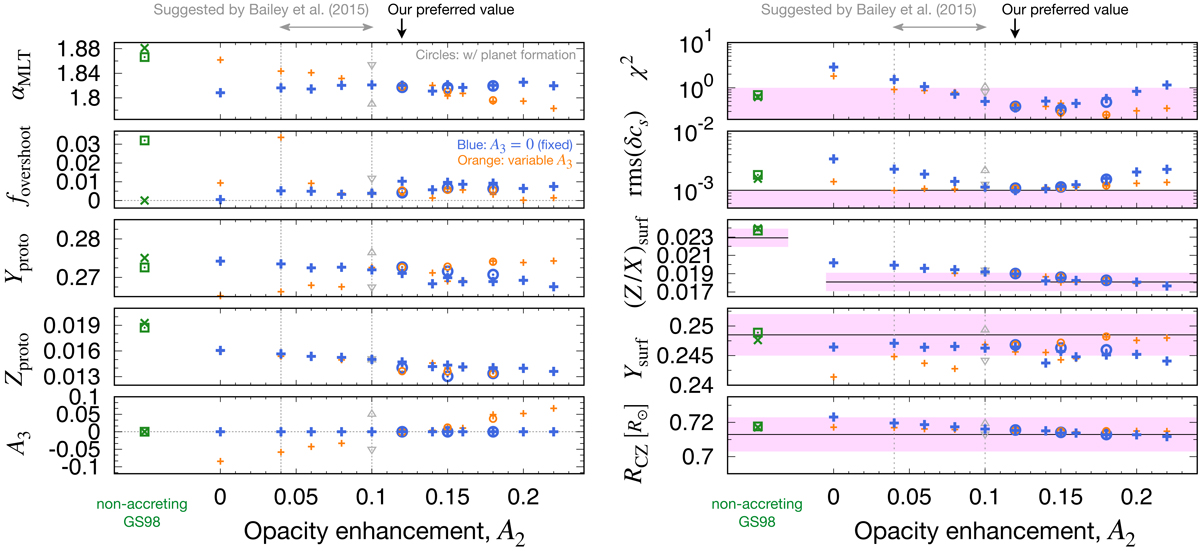
Fig. 6.
Download original image
Similar to Fig. 5 but showing the dependence on A2 in Runs 9, 10, 11, 13, and 14; in addition, the left bottom panel shows A3. The orange and blue colors indicate the cases with varying A3 and A3 = 0, respectively. The circles and plus signs denote the cases with and without planet formation, respectively (i.e., Zacc either evolves with time or is a constant). The gray triangles at A2 = 0.1 denote the cases with A3 = ±0.05. The two gray vertical lines demarcate the opacity enhancement (i.e., 7 ± 3%) suggested by Bailey et al. (2015).
Current usage metrics show cumulative count of Article Views (full-text article views including HTML views, PDF and ePub downloads, according to the available data) and Abstracts Views on Vision4Press platform.
Data correspond to usage on the plateform after 2015. The current usage metrics is available 48-96 hours after online publication and is updated daily on week days.
Initial download of the metrics may take a while.