Fig. 5.
Download original image
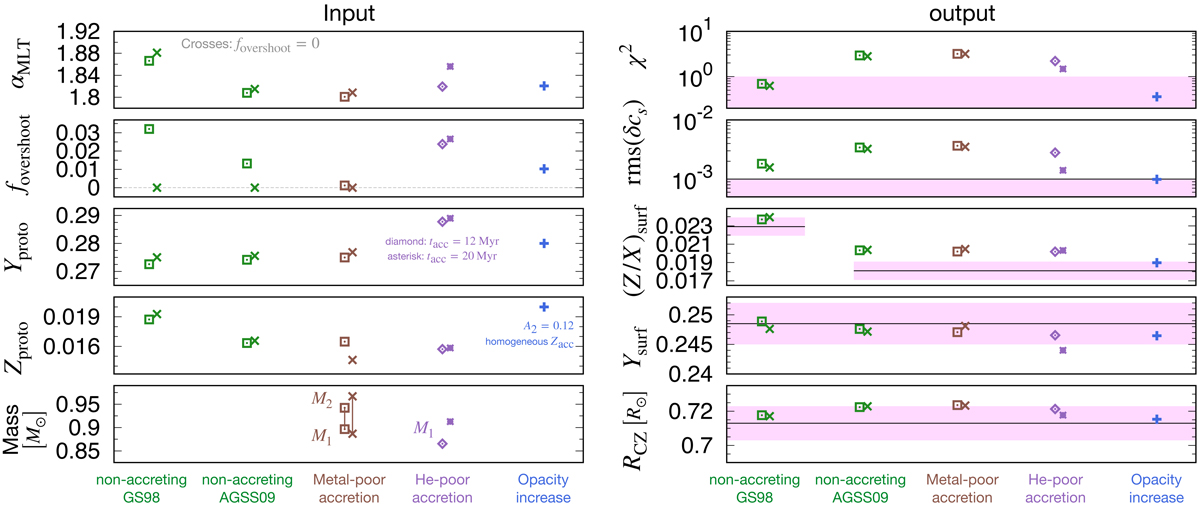
Optimized input parameters (left) and results at the solar age (right). The left panels show αMLT, fovershoot, Yproto, Zproto, and stellar mass (M1 and M2) for nine models from top to bottom. The right panels show the χ2 value (see Eq. (8)), rms(δcs), (Z/X)surf, Ysurf and RCZ from top to bottom. The five models shown in each panel are: non-accreting models with GS98 composition (Runs 2 and 4); non-accreting models with AGSS09 composition (Runs 1 and 3); accreting models with time-dependent Zacc (Runs 7 and 8); models with He-poor accretion (Runs 5 and 6); and K2 model (Run 9) with A2 = 0.12, from left to right (see Table 1 for details). Squares and crosses represent the cases with and without overshooting, respectively. Diamonds and asterisks represent the cases with He-poor accretion for tacc = 12 and 20 Myr, respectively. The shaded regions in the right panels indicate χ2 < 1 or the 1σ uncertainties (see Table 3).
Current usage metrics show cumulative count of Article Views (full-text article views including HTML views, PDF and ePub downloads, according to the available data) and Abstracts Views on Vision4Press platform.
Data correspond to usage on the plateform after 2015. The current usage metrics is available 48-96 hours after online publication and is updated daily on week days.
Initial download of the metrics may take a while.