Fig. 5.
Download original image
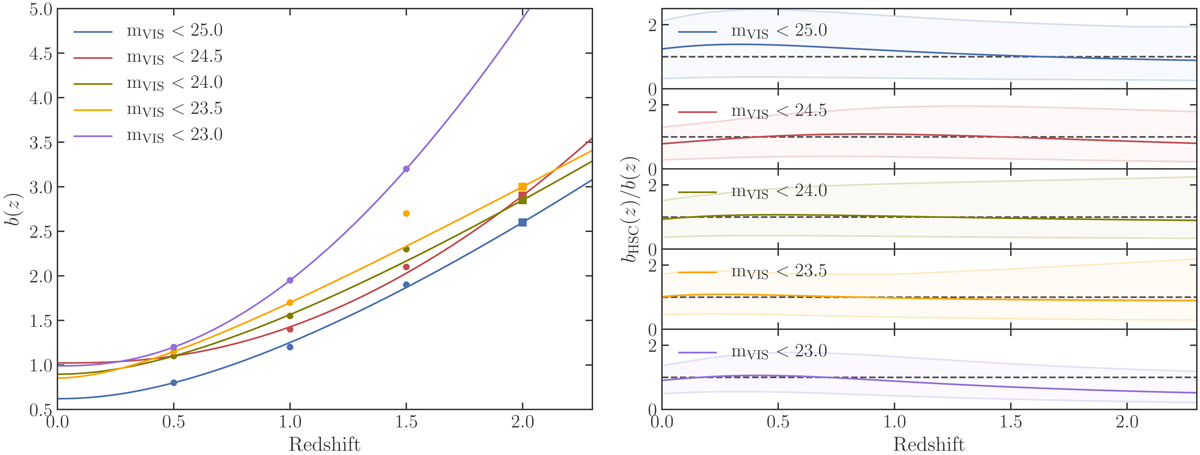
Left panel: galaxy bias as a function of redshift. Dots correspond to the measured values in the Flagship simulation for different magnitude cuts and the solid lines are a fit following Eq. (11). We plot with squares the bias values obtained for z = 2 to indicate that at that redshift there are few objects and thus the values are slightly less reliable. At mVIS < 23 there were not enough objects at z = 2 to compute the bias in Flagship. Right panel: ratio between the HSC bias, bHSC, from N20 and the Flagship bias for each magnitude-limited sample. To assess the 1σ uncertainty of bHSC along the redshift range, we generate a set of Gaussian random numbers for the free parameter α, b1, and b0 of bHSC with their values as mean and their errors as standard deviation. Then we evaluate bHSC in the redshift range for all the set of free parameters previously generated. We pick the maximum and minimum bHSC at each redshift. This corresponds to the shaded regions.
Current usage metrics show cumulative count of Article Views (full-text article views including HTML views, PDF and ePub downloads, according to the available data) and Abstracts Views on Vision4Press platform.
Data correspond to usage on the plateform after 2015. The current usage metrics is available 48-96 hours after online publication and is updated daily on week days.
Initial download of the metrics may take a while.