Fig. 14.
Download original image
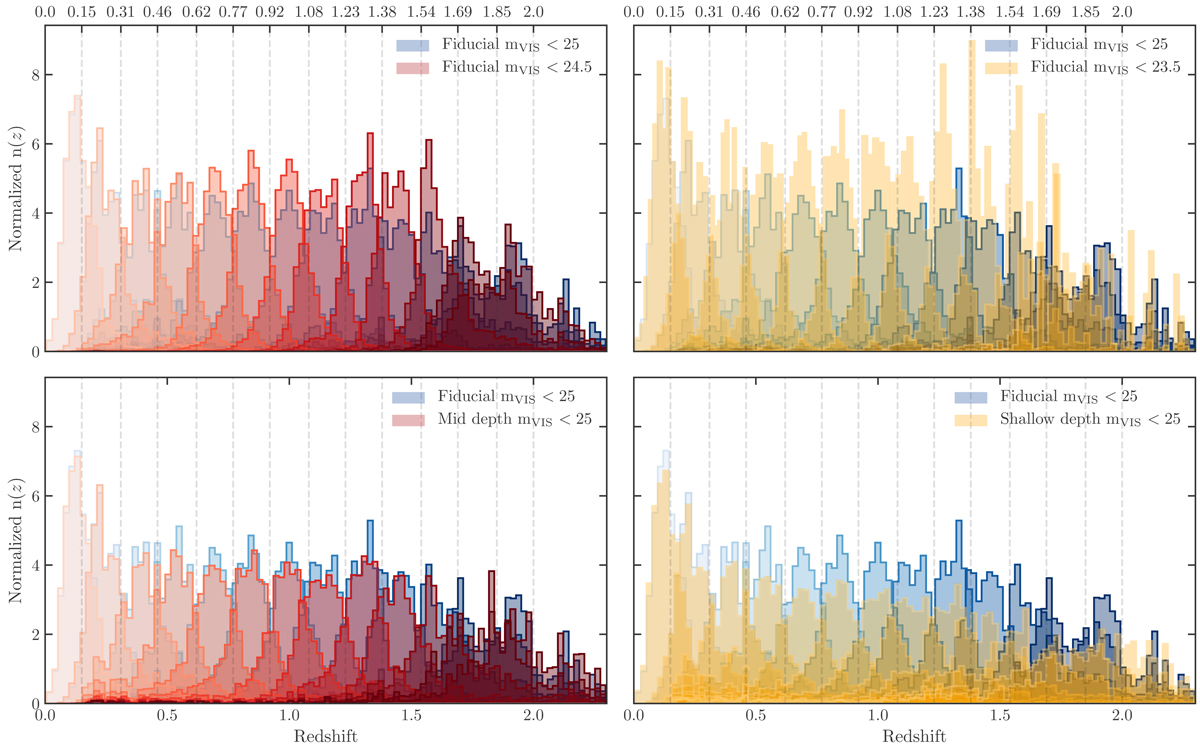
Top panels: redshift distribution (zmc) of each tomographic bin for the fiducial sample at mVIS < 25 compared to the fiducial at mVIS < 24.5 (left) and 23.5 (right). Bottom panels: redshift distribution (zmc) of each redshift bin for the fiducial sample compared to the mid depth (left) and shallow depth samples at mVIS < 25 (right).
Current usage metrics show cumulative count of Article Views (full-text article views including HTML views, PDF and ePub downloads, according to the available data) and Abstracts Views on Vision4Press platform.
Data correspond to usage on the plateform after 2015. The current usage metrics is available 48-96 hours after online publication and is updated daily on week days.
Initial download of the metrics may take a while.