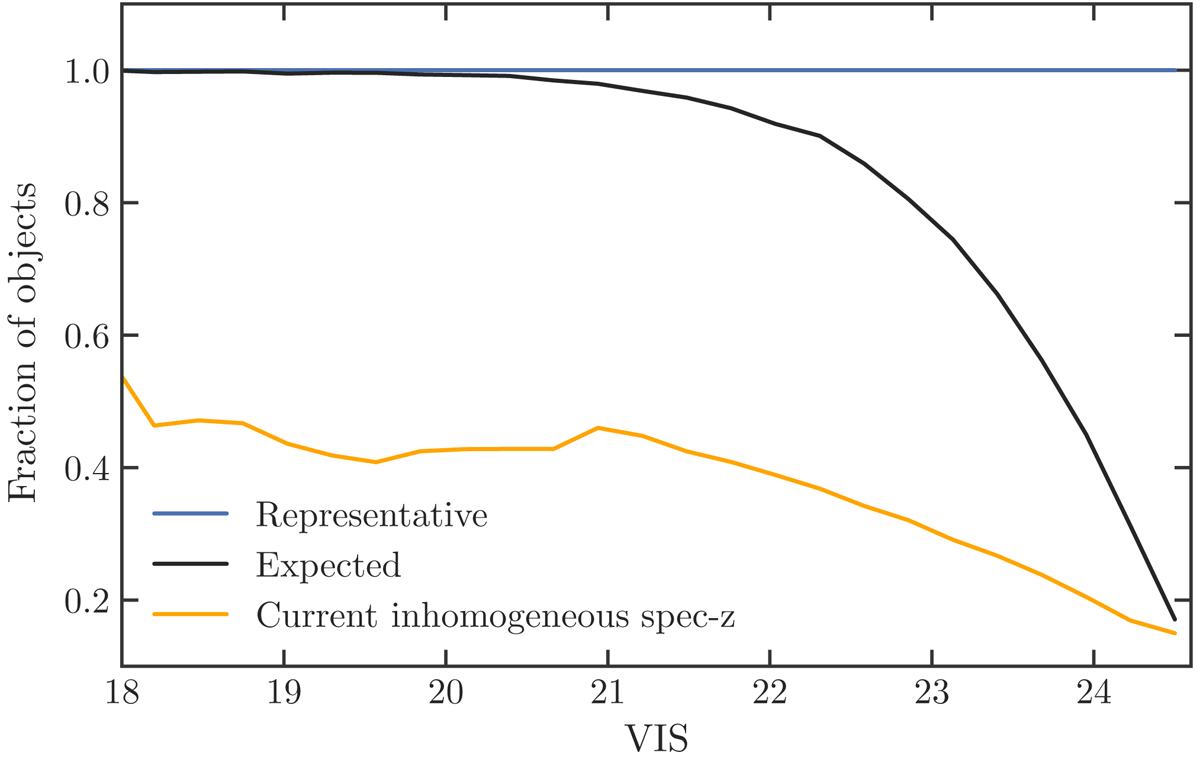
Fig. 1.
Download original image
Fraction of simulated objects with successful spectroscopic redshift as a function of mVIS. The lines represent the completeness fraction of the spectroscopic training samples. The blue line corresponds to the fraction of objects for a random training subsample that is fully representative of the sample under study. In black we show an expectation of the spectroscopic completeness for future ground-based surveys in mVIS (see text). In orange we present the completeness of a training sample with an n(z) similar to the currently available spectroscopic data (see text). The number of objects included in each training set is not represented by the normalization of the different curves in this figure (see Fig. 2 for the redshift distributions). Although our photometric samples go up to mVIS = 25, we cut the spectroscopic training samples at mVIS < 24.5 because realistic redshifts have not been reliably determined beyond that magnitude limit yet.
Current usage metrics show cumulative count of Article Views (full-text article views including HTML views, PDF and ePub downloads, according to the available data) and Abstracts Views on Vision4Press platform.
Data correspond to usage on the plateform after 2015. The current usage metrics is available 48-96 hours after online publication and is updated daily on week days.
Initial download of the metrics may take a while.