Fig. 9.
Download original image
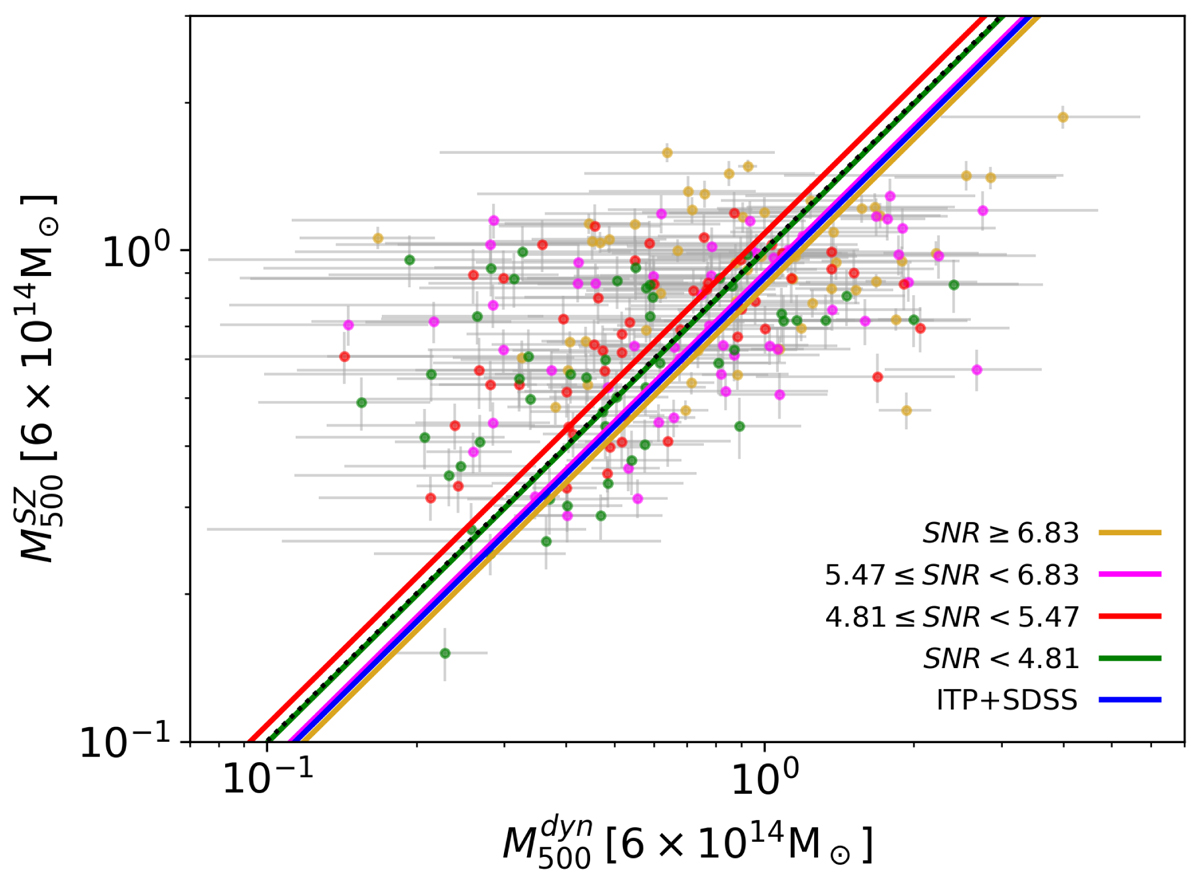
Scaling relation ![]() (fit of Eq. (12) with a fixed slope equal to 1) after correction for Eddington bias. Magenta, red, yellow, and green dots represent the clusters within the four S/N bins: S/N < 4.82, 4.82 ≤ S/N < 5.47, 5.47 ≤ S/N < 6.84, and S/N ≥ 6.84, respectively. After correcting for the Eddington bias, performed following the prescriptions by van der Burg et al. (2016), the best fits within the S/N bins (green, red, magenta, and yellow lines) are now compatible within 1.9 − σ at most with each other and with respect to the best fit of our whole sample (blue line). The dotted line represents the 1:1 relation.
(fit of Eq. (12) with a fixed slope equal to 1) after correction for Eddington bias. Magenta, red, yellow, and green dots represent the clusters within the four S/N bins: S/N < 4.82, 4.82 ≤ S/N < 5.47, 5.47 ≤ S/N < 6.84, and S/N ≥ 6.84, respectively. After correcting for the Eddington bias, performed following the prescriptions by van der Burg et al. (2016), the best fits within the S/N bins (green, red, magenta, and yellow lines) are now compatible within 1.9 − σ at most with each other and with respect to the best fit of our whole sample (blue line). The dotted line represents the 1:1 relation.
Current usage metrics show cumulative count of Article Views (full-text article views including HTML views, PDF and ePub downloads, according to the available data) and Abstracts Views on Vision4Press platform.
Data correspond to usage on the plateform after 2015. The current usage metrics is available 48-96 hours after online publication and is updated daily on week days.
Initial download of the metrics may take a while.