Fig. 8.
Download original image
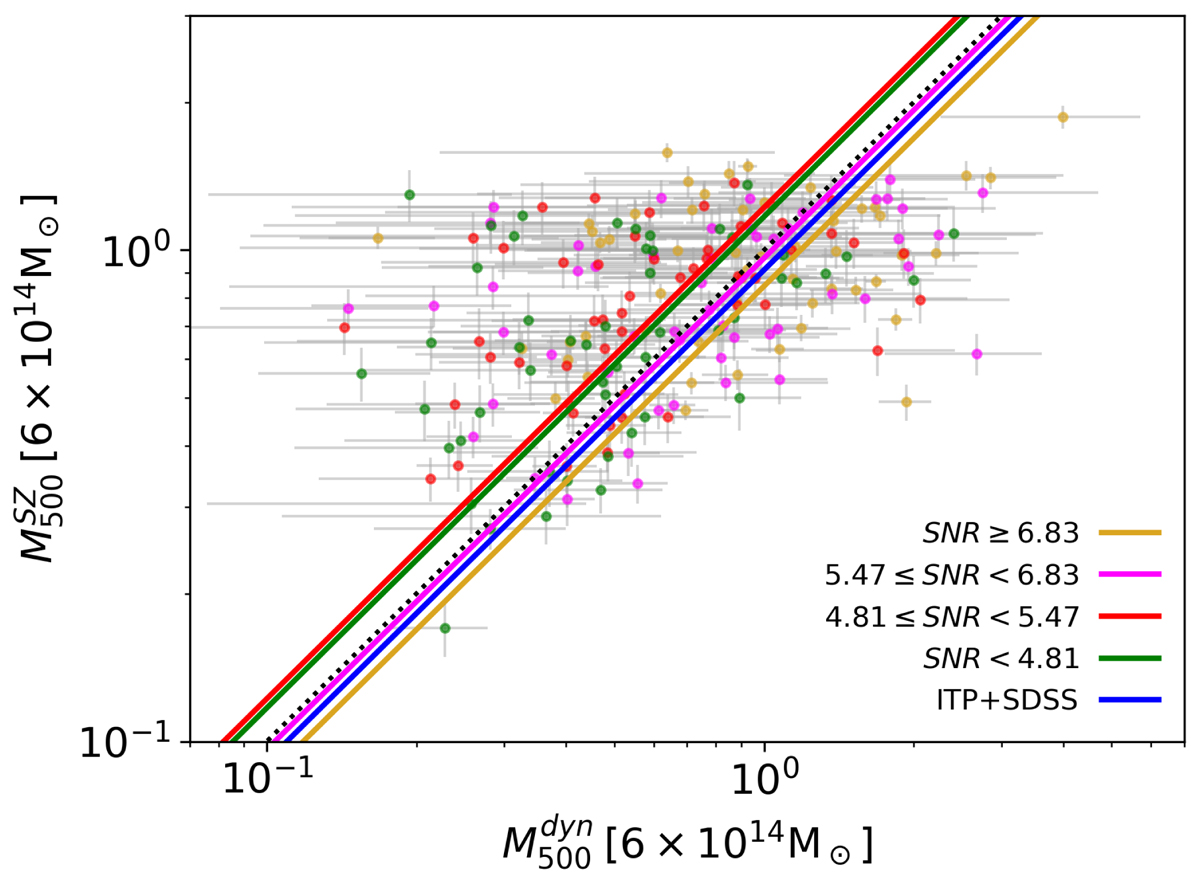
Fit of the scaling relation ![]() in Eq. (12) (with the slope fixed to 1) for the whole sample ITP+SDSS (blue line). Green, red, magenta, and yellow dots and lines represents the clusters within the four S/N bins: S/N < 4.81, 4.81 ≤ S/N < 5.47, 5.47 ≤ S/N < 6.83, and S/N ≥ 6.83 and their best fits, respectively. These fits are only marginally compatible within a maximum difference of 2.9 − σ. The dotted line represents the 1:1 relation.
in Eq. (12) (with the slope fixed to 1) for the whole sample ITP+SDSS (blue line). Green, red, magenta, and yellow dots and lines represents the clusters within the four S/N bins: S/N < 4.81, 4.81 ≤ S/N < 5.47, 5.47 ≤ S/N < 6.83, and S/N ≥ 6.83 and their best fits, respectively. These fits are only marginally compatible within a maximum difference of 2.9 − σ. The dotted line represents the 1:1 relation.
Current usage metrics show cumulative count of Article Views (full-text article views including HTML views, PDF and ePub downloads, according to the available data) and Abstracts Views on Vision4Press platform.
Data correspond to usage on the plateform after 2015. The current usage metrics is available 48-96 hours after online publication and is updated daily on week days.
Initial download of the metrics may take a while.