Fig. 7.
Download original image
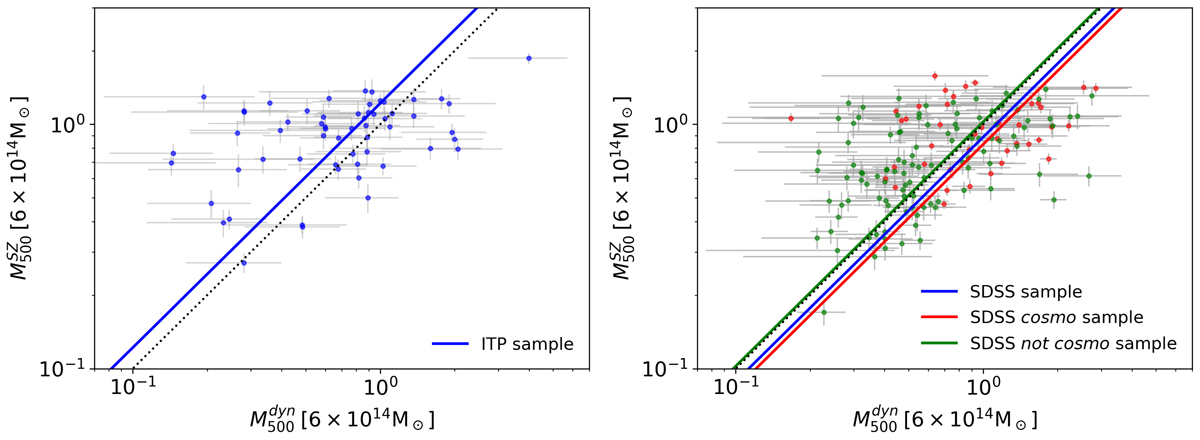
![]() scaling relation (Eq. (12) with the slope fixed to 1) for the ITP (left panel) and SDSS (right panel) samples. Red and green dots represent the SDSS clusters included in and excluded from the PlCS, respectively. Red, green, and blue lines are the best fit for the SDSS cosmo, the SDSS not cosmo, and the whole SDSS sample, respectively, whereas the dotted line is the 1 : 1 relation. The ITP and the SDSS fits are at 2.6 − σ. This difference between these fits suggests a possible Eddington bias contamination.x
scaling relation (Eq. (12) with the slope fixed to 1) for the ITP (left panel) and SDSS (right panel) samples. Red and green dots represent the SDSS clusters included in and excluded from the PlCS, respectively. Red, green, and blue lines are the best fit for the SDSS cosmo, the SDSS not cosmo, and the whole SDSS sample, respectively, whereas the dotted line is the 1 : 1 relation. The ITP and the SDSS fits are at 2.6 − σ. This difference between these fits suggests a possible Eddington bias contamination.x
Current usage metrics show cumulative count of Article Views (full-text article views including HTML views, PDF and ePub downloads, according to the available data) and Abstracts Views on Vision4Press platform.
Data correspond to usage on the plateform after 2015. The current usage metrics is available 48-96 hours after online publication and is updated daily on week days.
Initial download of the metrics may take a while.