Fig. 3.
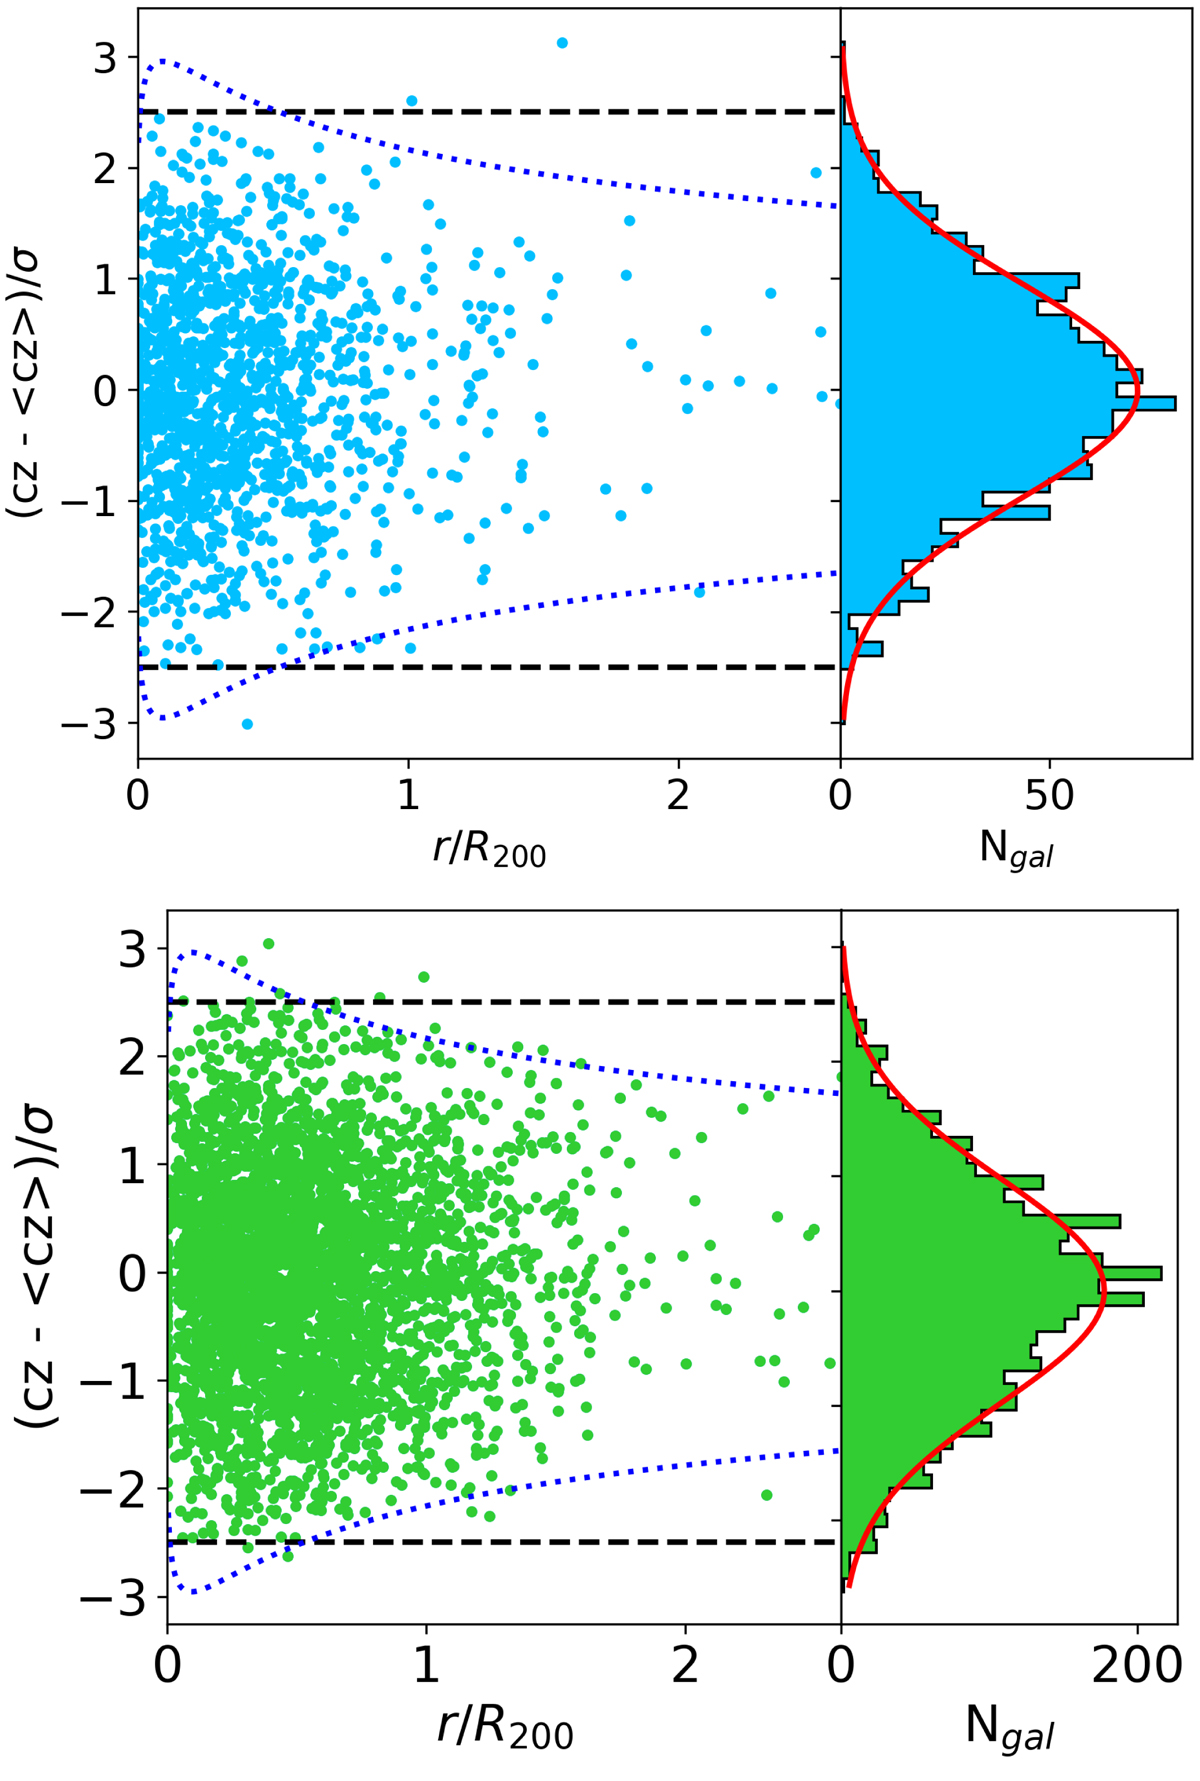
Download original image
Projected phase-space and velocity histogram of the stack of all ITP clusters members (top) and all SDSS cluster members (bottom). In both cases, velocities are normalised to the cluster velocity dispersion. The dashed black lines indicate the 2.5 − σ clipping, and the dotted blue lines show the same clipping, but take the velocity dispersion radial profile as shown in Łokas & Mamon (2001) into account. The red line in the right panel represents a Gaussian fit of the stacked velocity histogram normalised to the total number of members.
Current usage metrics show cumulative count of Article Views (full-text article views including HTML views, PDF and ePub downloads, according to the available data) and Abstracts Views on Vision4Press platform.
Data correspond to usage on the plateform after 2015. The current usage metrics is available 48-96 hours after online publication and is updated daily on week days.
Initial download of the metrics may take a while.