Fig. 11.
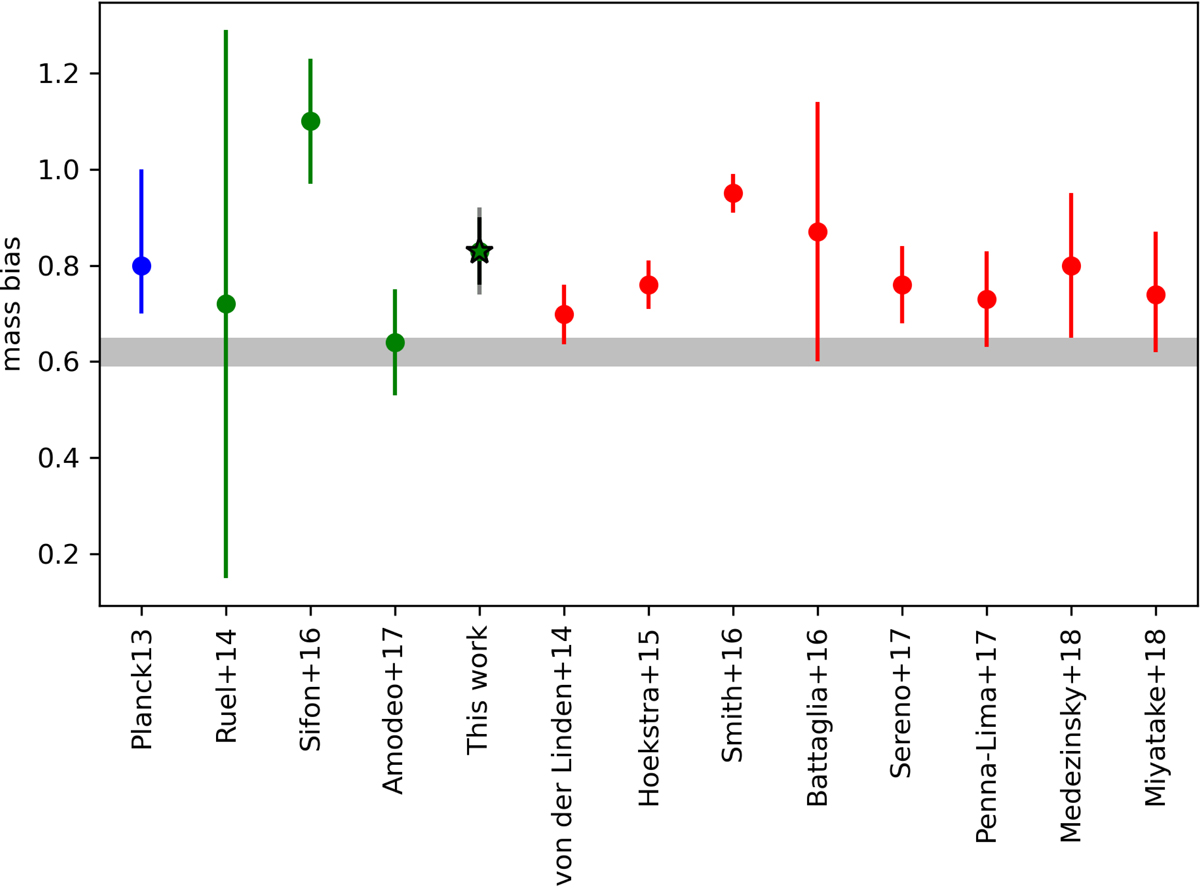
Download original image
Value of the mass bias from previous studies. In blue we show the result from Penna-Lima et al. (2017), using a scaling relation from X-ray observations; in green we plot the mass bias from Mdyn–MSZ scaling relations, and in red we show those from weak-lensing studies. All these values are listed in Table 4. The grey shaded region represents the mass bias values that reconciles the tension between CMB and SZ number counts from Penna-Lima et al. (2017). The green star represents the mass bias value we found here.
Current usage metrics show cumulative count of Article Views (full-text article views including HTML views, PDF and ePub downloads, according to the available data) and Abstracts Views on Vision4Press platform.
Data correspond to usage on the plateform after 2015. The current usage metrics is available 48-96 hours after online publication and is updated daily on week days.
Initial download of the metrics may take a while.