Free Access
Fig. 10.
Download original image
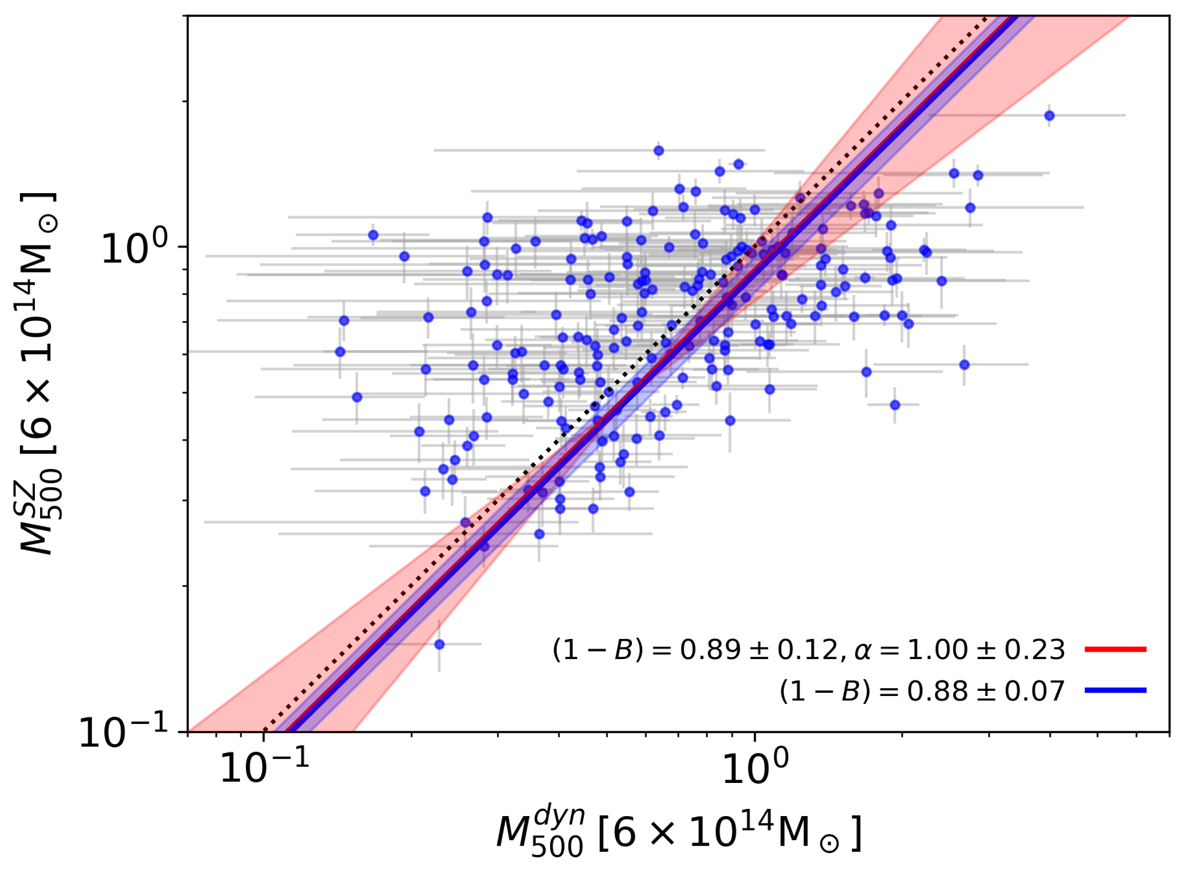
Scaling relation between ![]() and
and ![]() for the combined whole sample. The blue line represents the relation obtained by fixing the slope to α = 1 (blue line), and the red line represents the relation obtained when the slope was free to vary. The correction of the bias introduced by the ODR estimator is not applied here.
for the combined whole sample. The blue line represents the relation obtained by fixing the slope to α = 1 (blue line), and the red line represents the relation obtained when the slope was free to vary. The correction of the bias introduced by the ODR estimator is not applied here.
Current usage metrics show cumulative count of Article Views (full-text article views including HTML views, PDF and ePub downloads, according to the available data) and Abstracts Views on Vision4Press platform.
Data correspond to usage on the plateform after 2015. The current usage metrics is available 48-96 hours after online publication and is updated daily on week days.
Initial download of the metrics may take a while.