Fig. 17.
Download original image
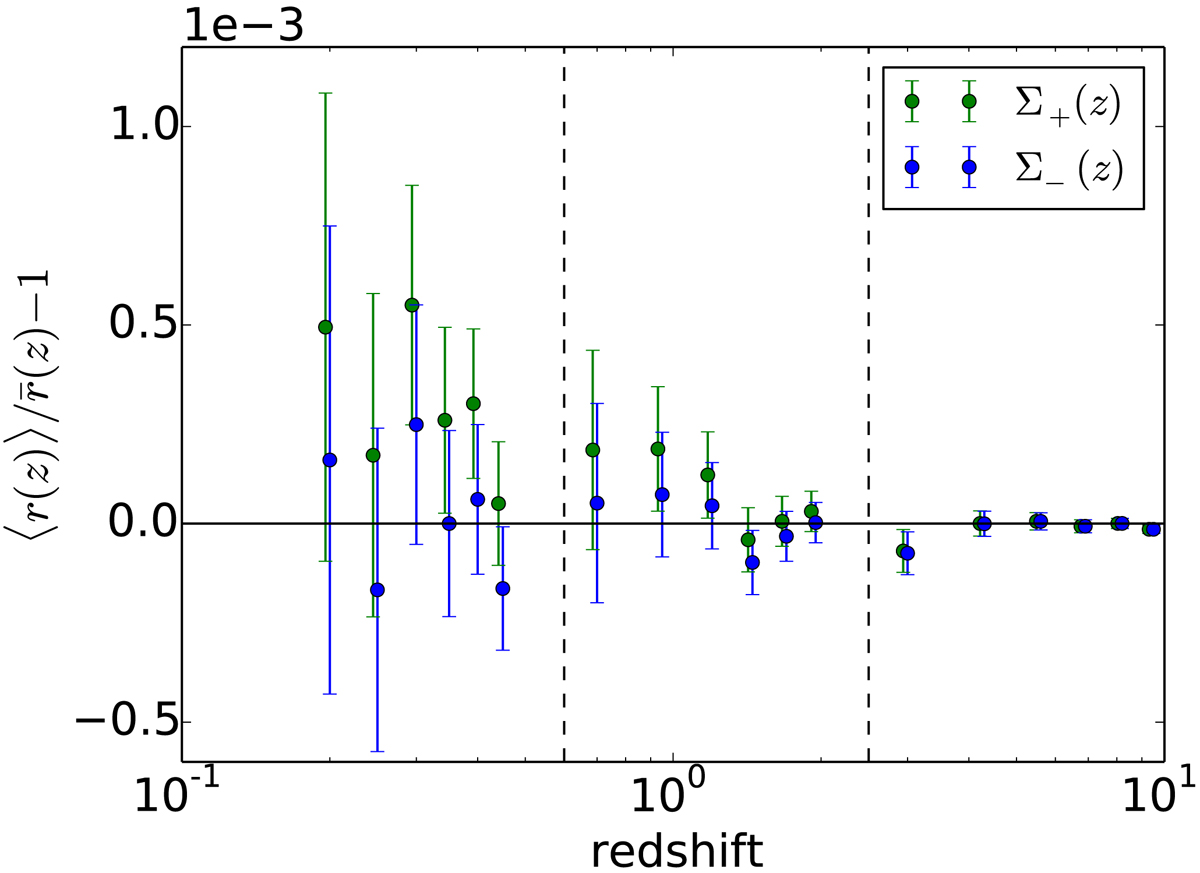
Radial shift of surfaces of constant redshift. Dots indicate numerical results for ![]() while error bars account for Poisson variance and for the super-sample variance due to peculiar velocities only. For each z, we provide two values of the mean shift: one across the closest iso-z surface [Σ−(z), blue] and the other across the fathest iso-z surface [Σ+(z), green].
while error bars account for Poisson variance and for the super-sample variance due to peculiar velocities only. For each z, we provide two values of the mean shift: one across the closest iso-z surface [Σ−(z), blue] and the other across the fathest iso-z surface [Σ+(z), green].
Current usage metrics show cumulative count of Article Views (full-text article views including HTML views, PDF and ePub downloads, according to the available data) and Abstracts Views on Vision4Press platform.
Data correspond to usage on the plateform after 2015. The current usage metrics is available 48-96 hours after online publication and is updated daily on week days.
Initial download of the metrics may take a while.