Fig. 15.
Download original image
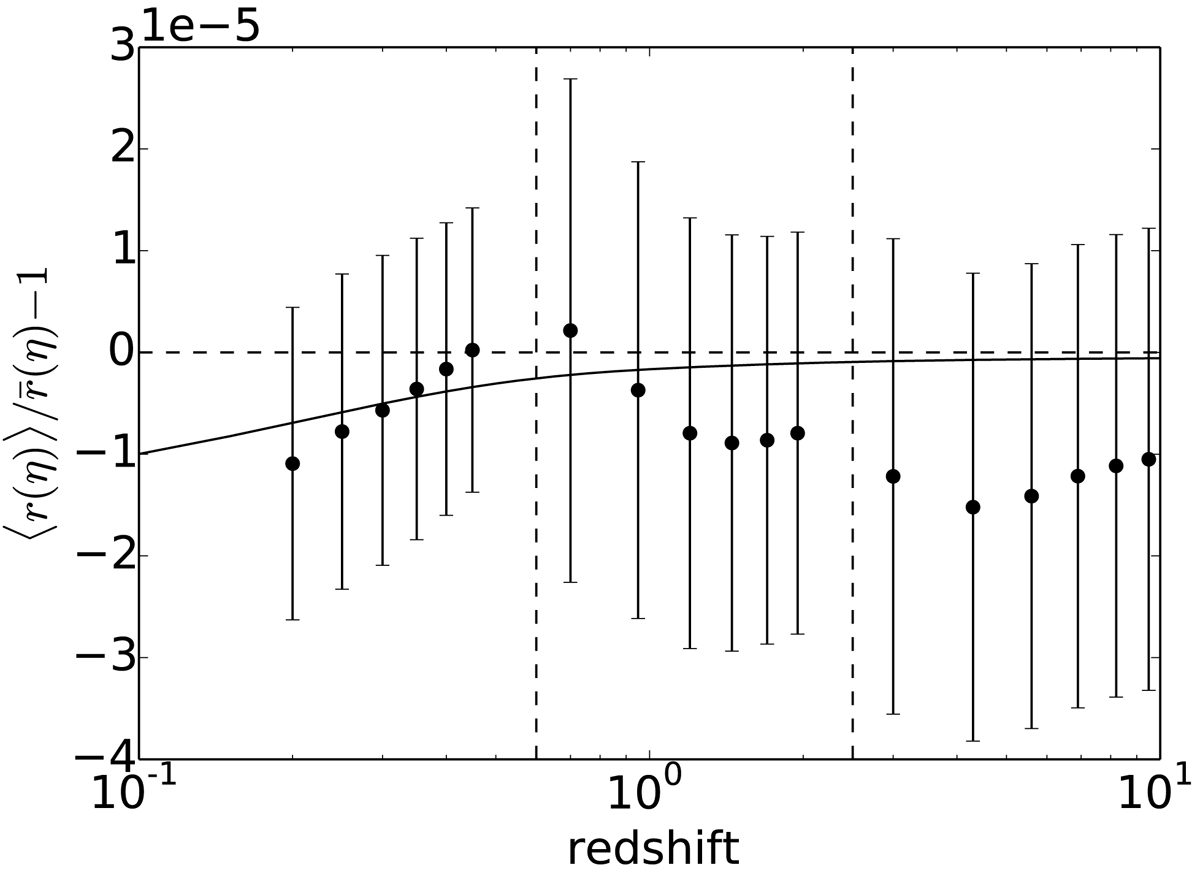
Mean comoving distance reached at fixed time, ⟨r(η)⟩, compared to its background counterpart ![]() . The difference combines the wiggly-ray and Shapiro time-delay effects. The x-axis indicates
. The difference combines the wiggly-ray and Shapiro time-delay effects. The x-axis indicates ![]() instead of η for better readability. Dots indicate numerical results and error bars are computed according to Appendix D.4. The dashed line indicates the unconstrained theoretical prediction (71), while the solid line shows the prediction (72) that accounts for our knowledge of the gravitational potential ϕ0 at the observer.
instead of η for better readability. Dots indicate numerical results and error bars are computed according to Appendix D.4. The dashed line indicates the unconstrained theoretical prediction (71), while the solid line shows the prediction (72) that accounts for our knowledge of the gravitational potential ϕ0 at the observer.
Current usage metrics show cumulative count of Article Views (full-text article views including HTML views, PDF and ePub downloads, according to the available data) and Abstracts Views on Vision4Press platform.
Data correspond to usage on the plateform after 2015. The current usage metrics is available 48-96 hours after online publication and is updated daily on week days.
Initial download of the metrics may take a while.