Fig. 13.
Download original image
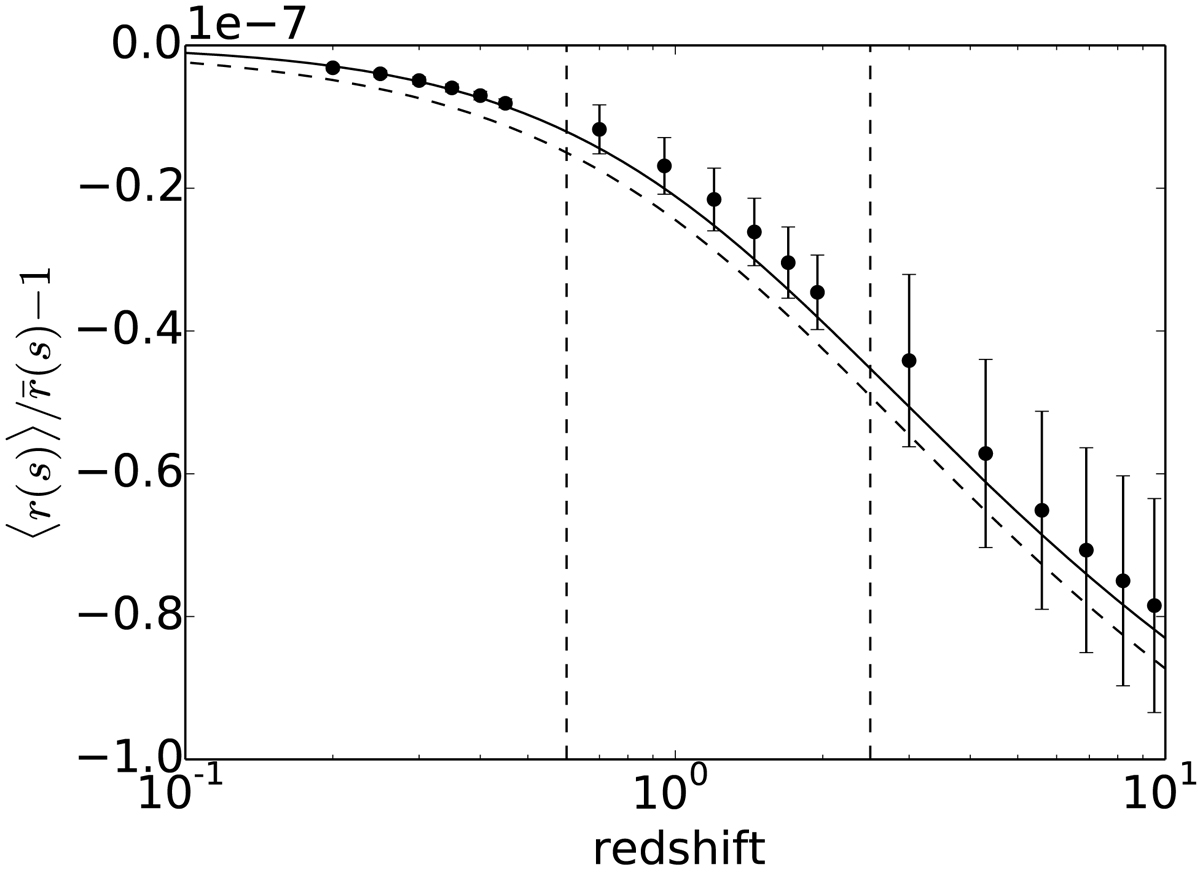
Wiggly ray effect: Mean fractional reduction ![]() of the comoving distance r(s) reached after travelling a comoving distance s. The x-axis indicates the redshift
of the comoving distance r(s) reached after travelling a comoving distance s. The x-axis indicates the redshift ![]() instead of s for better readability. Dots indicate directional averages in the simulation ⟨r(s)⟩d; the dashed and solid lines respectively indicate the theoretical predictions of Eqs. (68) and (69). Error bars are computed following Appendix D.2.
instead of s for better readability. Dots indicate directional averages in the simulation ⟨r(s)⟩d; the dashed and solid lines respectively indicate the theoretical predictions of Eqs. (68) and (69). Error bars are computed following Appendix D.2.
Current usage metrics show cumulative count of Article Views (full-text article views including HTML views, PDF and ePub downloads, according to the available data) and Abstracts Views on Vision4Press platform.
Data correspond to usage on the plateform after 2015. The current usage metrics is available 48-96 hours after online publication and is updated daily on week days.
Initial download of the metrics may take a while.