| Issue |
A&A
Volume 655, November 2021
|
|
|---|---|---|
| Article Number | A102 | |
| Number of page(s) | 8 | |
| Section | Extragalactic astronomy | |
| DOI | https://doi.org/10.1051/0004-6361/202039771 | |
| Published online | 29 November 2021 | |
Implications of the lowest frequency detection of the persistent counterpart of FRB121102
1
Anton Pannekoek Institute/GRAPPA, Amsterdam 1098 XH, The Netherlands
e-mail: This email address is being protected from spambots. You need JavaScript enabled to view it.
2
Indian Institute of Space Science & Techonology, Trivandrum 695047, India
e-mail: This email address is being protected from spambots. You need JavaScript enabled to view it.
3
National Center for Radio Astrophysics, Pune 411007, India
Received:
27
October
2020
Accepted:
28
May
2021
Abstract
Context. The repeating FRB121102 is so far the only extragalactic fast radio burst found to be associated with a counterpart, that is to say a steady radio source with a nearly flat spectral energy distribution (SED) in centimeter wavelengths.
Aims. Previous observations of the persistent source down to 1.6 GHz have not provided a sign of a spectral turnover. Absorption is expected to eventually cause a turnover at lower frequencies. Better constraints on the physical parameters of the emitting medium can be derived by detecting the self-absorption frequency.
Methods. We used the Giant Metre-Wave Radio Telescope during the period of July to December 2017 to observe the source at low radio frequencies down to 400 MHz.
Results. The spectral energy distribution of the source remains optically thin even at 400 MHz, with a spectral index of ν−(0.07 ± 0.03), which is similar to what is seen in Galactic plerions. Using a generic synchrotron radiation model, we obtain constraints on properties of the nonthermal plasma and the central engine powering it.
Conclusions. We present low frequency detections of the persistent source associated with FRB121102. Its characteristic flat SED extends down to 400 MHz. Similar to models for Galactic plerions, we assume that the energy in the persistent source is carried predominantly by leptons. The emitting plasma has a B < 0.01 G, and its age is >524(B/0.01 G)−3/2 yr. We show that the energetics of the persistent source requires an initial spin period shorter than 36 ms, and the magnetic field of the neutron star must exceed 4.5 × 10¹² G. This implies that the persistent source does not necessarily require energetic input from a magnetar.
Key words: radiation mechanisms: non-thermal / radio continuum: general
© ESO 2021
1. Introduction
Fast radio bursts (FRBs) are extragalactic transients of a millisecond duration appearing in the radio band of the electromagnetic spectrum (Lorimer et al. 2007; Thornton et al. 2013, see Petroff et al. 2019; Cordes & Chatterjee 2019 for recent reviews). Out of the hundreds of FRBs discovered so far, some have been found to repeat (Spitler et al. 2016a; Amiri et al. 2019; CHIME/FRB Collaboration 2019a,b; Kumar et al. 2019; Fonseca et al. 2020). Precise localization has been achieved for a handful of FRBs so far (Chatterjee et al. 2017; Ravi et al. 2019; Prochaska et al. 2019; Bannister et al. 2019; Macquart et al. 2020). While the exact mechanism responsible for the coherent radio emission is still unclear (Platts et al. 2019), FRBs are believed to be associated with neutron stars (NSs), particularly magnetars (Popov & Postnov 2013; Lyubarsky 2014; Kulkarni et al. 2014; Katz 2016; Metzger et al. 2017; Nicholl et al. 2017; Kumar et al. 2017; Lu & Kumar 2018; Beloborodov 2017).
The recent discovery of bright radio bursts from the Galactic magnetar SGR 1935+2154 (CHIME/FRB Collaboration 2020; Bochenek et al. 2020) has confirmed that magnetars can indeed produce coherent radio bursts similar to extragalactic FRBs, providing a new breakthrough in FRB research. It is important to note that the radio fluence of the SGR 1935+2154 FRB is an order of magnitude lower than those of extragalactic FRBs (e.g., Margalit et al. 2020), and there is no settled theory yet as to what mechanisms power FRBs, whether Galactic or extragalactic (Margalit et al. 2020; Lu et al. 2020). So one should be aware that there may not be a one-to-one correspondence between the SGR 1935+2154 FRB and extragalactic FRBs. The extragalactic FRBs are likely powered by magnetars, but these may have different properties from the bulk of the Galactic magnetars, such as stronger internal magnetic fields or long rotation periods (Beniamini et al. 2020).
Apart from SGR 1935+2154, the only counterpart associated with an FRB is the persistent radio source (Chatterjee et al. 2017; Marcote et al. 2017) near the first repeating FRB, FRB121102 (Spitler et al. 2014, 2016b). It is colocated with the FRB position, within a separation less than 12 mas from the FRB burst position, corresponding to a projected linear distance of ∼40 pc for z = 0.19 (Marcote et al. 2017). Such a close proximity suggests that the two sources may be directly linked. Its radio luminosity is a few orders of magnitude higher than that of SNRs and pulsar wind nebulae (PWNe) in our Galaxy (Marcote et al. 2017). Therefore, the most popular model for the persistent source is of a nebula powered by a newborn (< 100 yr) magnetar (Murase et al. 2016; Metzger et al. 2017; Waxman 2017) or a SNR energized by the spin-down luminosity of a young NS (Piro 2016). While no systematic change is seen in the 3 GHz observations spanning for 150 days (from April to September 2016), a 10% day-scale variability is observed by Chatterjee et al. (2017), which is probably a consequence of scintillation (Waxman 2017).
The persistent source has a flat nonthermal radio spectrum between 1.6 GHz and 11 GHz followed by a cutoff (Chatterjee et al. 2017). Several authors have used the spectral energy distribution (SED) to derive physical parameters of the medium around the FRB assuming a NS powered synchrotron nebula for the persistent source (Beloborodov 2017; Waxman 2017; Murase et al. 2016; Metzger et al. 2017; Dai et al. 2017; Yang & Dai 2019). These calculations use the self-absorption frequency in deriving the physical parameters, which in most cases is assumed at ∼1 GHz, given that the lowest frequency observations reported for the persistent source thus far are at 1.6 GHz (Chatterjee et al. 2017). To confirm whether the expected synchrotron self-absorption is indeed present, it is important to probe the nature of the SED in lower radio bands. Either detecting a synchrotron self-absorption break frequency or a lower limit to a break frequency can be used to derive tighter constraints on the physical parameters of the persistent source.
We used the Giant Metre-wave Radio Telescope (GMRT) to observe the source in frequencies below 1 GHz. In this paper, we report an upgraded GMRT (uGMRT) band-3 (300 − 500 MHz) detection of the persistent source at the ∼200 μJy level, which reveals an optically thin spectrum extending to lower frequencies. While this manuscript was in preparation, another group used a different set of observations in the same bands to present the low frequency SED of the source (Mondal et al. 2020). The reported fluxes are consistent with our measurements and further confirm the absence of any systematic change in the source flux. We used a generic synchrotron radiation model to derive constraints on the magnetic-field and number density of the nonthermal plasma.
We present our observations in Sect. 2 and constraints derived using a synchrotron source model in Sect. 3. We summarize our results in Sect. 4.
2. GMRT observations
Our GMRT observations of the persistent source span epochs from July to December, 20171. In the uGMRT observations, for both band-5 and band-3, we used 3C147 as both the primary and secondary calibrator. For legacy-GMRT observations we used 0431+206 as the secondary calibrator for 1390 MHz observations and 0410+769 for 610 and 325 MHz. Standard calibrators 3C147, 3C48, and 3C286 are used for primary calibration depending on the day of the observation.
Our first observation was in 1390 MHz on 20 May 2017, followed by in 610 MHz on 03 Jul 2017 both using the narrow-band 32 MHz correlator. We detected a flux density of 148.5 ± 60.0 μJy in 1390 MHz and 276.5 ± 69.0 μJy in 610 MHz. We could not detect the source confidently in the 325 MHz narrow band observation. In order to improve the map quality we further observed the source using the wide-band correlators of the uGMRT in band-3 (200 − 300 MHz) and band-5 (1050 − 1450 MHz) on 16th and 10th Dec. 2017 respectively. We detected the source in band-5 with a flux density of 242 ± 11 μJy, and in band-3 with 203.5 ± 33.6 μJy. The details of all GMRT observations are listed in Table 1 and the maps are presented in Fig. 1. Our band-5 detections are consistent within the 10% expected variability of the 1.6 GHz JVLA flux and 1.7 GHz EVN flux measured by Chatterjee et al. (2017) and Marcote et al. (2017) respectively.
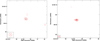 |
Fig. 1. uGMRT contour maps of the central portion of the field. The synthesized beam is shown in the lower-left corner. The FRB position from Chatterjee et al. (2017) is shown as black cross. Left: band-3 map, with contour levels at (3, 4, 5)×34 μJy. Right: band-5 contours having levels of (4, 5, 10, 15, 20, 25)×13 μJy. |
GMRT observations of the persistent counterpart of FRB121102.
We used the Astronomical Image Processing System (AIPS) to analyze the narrow band data and a custom-made CASA pipeline to analyze the wide band data. The fits files were imported to AIPS and the task JMFIT was used to estimate the flux, assuming a two-component intensity distribution, a Gaussian and a flat noise bed, around the position of the FRB. In all maps, the best-fit position of the Gaussian peak is consistent with the reported EVN location by Marcote et al. (2017), within the GMRT synthesized beam.
Using optical and IR observations of the host galaxy, Bassa et al. (2017) have found that a bright star-forming region encompasses the location of the persistent source. From Hα images, and using the 1.4 GHz-Hα correlation (Murphy et al. 2011), Bassa et al. (2017) estimates ∼3μJy flux at 1.4 GHz. It is possible that the observed Hα flux is not entirely from the star forming region, which can further reduce its 1.4 GHz emission for the given correlation. Using a spectral index of −1, one of the steepest reported for star-forming regions in low radio frequencies (Rosero et al. 2016; Murphy et al. 2017), the highest possible flux at 400 MHz can be calculated as 10 μJy, well below the detection at band-3. Shallower spectral indices, for example −0.5, will yield a flux of 5 μJy. Therefore we can safely ignore the contribution of the star-forming region in this analysis.
3. Synchrotron spectrum model
The uGMRT band-3 detections have confirmed that the spectral energy distribution of the persistent source is optically thin even down to 400 MHz. Along with the cutoff in the spectrum at higher frequencies observed by the Jansky-VLA, it is possible to arrive at combined constraints for the physical parameters of the emitting plasma.
To proceed, we assume that the emission process is nonthermal synchrotron radiation. The radio SED of the persistent source is flat, similar to that of Galactic plerions, and has a break around 10 GHz. This break could be related to the acceleration process or due to synchrotron radiative losses. In the latter case, for a continuous injection of electrons, the spectral index increases by 0.5, much shallower than what is observed for this source. However, instantaneous injection can produce the sharp rollover as we later show in Sect. 3.2. Motivated by this, to begin with we fit the SED with a double power-law spectral model given by,
![Mathematical equation: $$ \begin{aligned} f_{\nu } = f_0 \left(\left[\frac{\nu }{\nu _{\rm b}}\right]^{s m_1} + \left[\frac{\nu }{\nu _{\rm b}}\right]^{s m_2}\right)^{-1/s}, \end{aligned} $$](/articles/aa/full_html/2021/11/aa39771-20/aa39771-20-eq2.gif) (1)
(1)
where f0 is the flux normalization, νb is the spectral cutoff, m1 is the asymptotic spectral index for ν ≪ νb and m2 is the same for ν ≫ νb. We found that keeping the smoothing index s < 5 leads to poor inferences of m1, therefore in the results used below we have assumed s = 5. The inferred values of other parameters are slightly sensitive to the value of s assumed. Minimizing the χ2 through a Levenberg-Marquardt algorithm, we find that m1 = 0.07 ± 0.03, m2 = 1.31 ± 0.2, f0 = 200.7 ± 11.3 μJy, and νb = 9.2 ± 1.0 GHz, leading to fν = 9.2 GHz = 175 μJy. The best-fit model is presented in Fig. 2. The spectral index before the break corresponds to a rather flat spectral index for the underlying electron energy distribution of p = 2m1 + 1 = 1.14 ± 0.06. Such a flat index is not expected for diffusive shock acceleration, as either relativistic or nonrelativistic shocks typically produce distributions with p ≳ 2. But the spectral index is consistent with those of PWNe, which have typically spectral indices of m = 0 − 0.3 (e.g., Kothes 2017), corresponding to p = 1 − 1.6. In contrast, young supernova remnants–or so-called radio supernovae–tend to have rather steep spectral indices of m ≈ 0.8 (e.g., Weiler et al. 2010), which is inconsistent with the nebula associated with FRB121102.
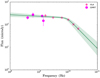 |
Fig. 2. Fit to the near-simultaneous SED of the persistent source by an empirical double power-law model. |
The difference δm in the spectral indices is ∼1.25, very different from what is expected due to synchrotron cooling of continuously injected electrons (δm = 0.5, e.g., Longair 2011). In the case of continuous electron injection, the cooling break frequency corresponds to the electron energy below which cooling has not affected the initial electron energy over the entire age of the source. Above the cooling break, the emission originates from electrons that have been injected in the nebula in more recent times, increasingly so for higher electron energies/synchrotron frequencies. On the other hand, if the electron injection reduced significantly some time after the creation of the nebula, the highest energy electrons are not replenished and there are fewer electrons present above the cooling break. The result is a spectral break that is sharper than δm = 0.5 or even a cutoff in the spectrum (cf. Figs. 13.8 and 13.9 in Vink 2020).
Given that the break is indeed sharp (δm ∼ 1.25), we assume the break to be due to radiative cooling of an electron/positron population that was predominantly injected during a time scale that was relatively short compared to the age of the persistent source. Along with the observed absence of self-absorption at low frequencies, in the next section we derive constraints on the emission region assuming it to be powered by a pulsar. For our interpretation of the spectral properties, it is assumed that the flat spectrum is caused by an intrinsically flat electron/positron injection spectrum. We note that this is generally the case for PWNe, but other interpretations may be possible. For example, for some extragalactic radio sources, a flat spectrum could also result from superposition of individual self-absorbed synchrotron components (Blandford & Königl 1979; Cotton et al. 1980), a possibility we are not considering in this article.
3.1. Constraints on the physical parameters of the plasma
In this section, we assume a nonthermal electron distribution, emitting synchrotron radiation, assumed to be characterised by a uniform magnetic-field strength, B. High energy electrons are affected by radiative cooling. The optically thin spectrum implies that the photons are not self-absorbed. For a compact source, a limiting value of self-absorption implies a lower magnetic field. On the other hand, energetic considerations can give a relation between B and the radius, R, for an observed flux, where B decreases monotonically for increasing R. Together, these two arguments, therefore, can provide stringent limits on the B − R plane. In addition, the absence of a synchrotron cooling break, νb, above 400 MHz gives constraints on the age of the source for a given magnetic field.
3.1.1. Self-absorption limit
First, we describe our derivation of the self-absorption frequency. For a source optically thick to frequency ν, the observed flux is  , where kB is the Boltzmann constant and c is the speed of light. The term
  represent the solid angle subtended by the emission region of radius R at a distance dL. For a synchrotron source, the brightness temperature Tb can be approximated as γamec2/kB, where γa is the Lorentz factor of the electron whose synchrotron power-spectrum peaks at the self-absorption frequency νa. γa and νa are related through the characteristic synchrotron frequency νsyn. Using,
  , where e is the elementary charge and me is the mass of electron, one can finally obtain the flux at νa to be2,
 (2)
(2)
Using this equation along with the observed flux at 400 MHz, we obtain the upper-limit to B as a function of the radius of the plasma. In Fig. 3, this upper-limit is represented by the magenta line. The region in the B − R plane is consistent with the optically thin spectrum down to 400 MHz is shaded in pink.
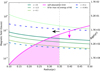 |
Fig. 3. Constraints on the parameters of the emitting plasma from available observations. Minimum energy requirements and the optically thin radio SED together restricts the allowed region in the plane of magnetic field (B) and radius (R). Considering the spectral break at 9.2 GHz to be due to synchrotron cooling, B can be translated to the age of the source (second y-axis). The magenta solid line and the shaded region correspond to self-absorption frequency, νa ≤ 400 MHz. The thick solid lines in shades of green represent B versus R relation resulting from the minimum energy argument for different values of the magnetization parameter σ (see text for details). The sensitivity on the electron energy spectral index is not high and we have used p = 1.2 in this calculation. The thin green line corresponds to the highest magnetic field possible, if 1052 ergs of magnetar rotational energy is converted to magnetic fields. Dashed lines in shades of blue result from equating the age obtained through synchrotron cooling with R/v, where v is assumed expansion velocity. VLBI upper limit on the radius of the source is indicated with a black arrow. |
3.1.2. Energetic constraints
Next, we derive the relation between B and R for for an arbitrary magnetization parameter σ defined as the ratio uB/ue between the energy in the magnetic field to the nonthermal electrons. This is a generalization of the equipartition argument.
The energy density in nonthermal electrons can be written as  , for p < 2, where γM is the maximum electron Lorentz factor, p is the power-law index and Ke is the normalization of the electron distribution. As the electron distribution is flat for this source, the dominant contribution to ue comes from electrons at γM (i.e., in this case the electrons radiating at the break νb). This assumption is valid even if the break is due to radiative cooling, as essentially the distribution is bounded within γM. Therefore, we have considered the minimum electron Lorentz factor γm ≪ γM and ignored it in the equation. In terms of the observed luminosity at the break, the normalization Ke can be written as
 (3)
(3)
where σT is the Thomson scattering cross-section. We have provided the derivation of this equation in the Appendix A.
After substituting for γM in ue in terms of νb and using uB = B2/(8π), we finally obtain the relation between B and R for a given magnetization parameter σ as,
 (4)
(4)
In Fig. 3, we present the B − R relation for a range of σ values as solid lines in shades of green. We can see that high σ values are not consistent with the self-absorption limit. A low σ has also been inferred for Galactic PWNe, such as the Crab Nebula (Kennel & Coroniti 1984). We note that σ = 4/3 corresponds to the minimum energy requirement, often used to infer the energetics of nonthermal radio sources (Longair 2011). Moreover, we can also see that the VLBI upper-limit to the source size limits the magnetic field to be below 0.05 G.
The second y-axis of Fig. 3 correspond to the age of the source under the assumption that νb is due to synchrotron losses, given by,
 (5)
(5)
Cooling time corresponding to B = 0.05 G is 42 years, which gives a lower-limit to the age of the persistent source.
We also see how limits on the average expansion velocity ⟨v⟩ of the source can be represented on the B − R plane. There are two constraints on the age of the source. The first one is from the break due to synchrotron cooling and the second one is from the radius (tage = R/⟨v⟩). Together, they lead to a B versus R relation for a given ⟨v⟩. These are shown as dashed curves in shades of blue corresponding to different ⟨v⟩. As expected, higher velocity curves and higher σ appear at the upper part of the plane. We see that to be consistent with the self-absorption limit, ⟨v⟩< 0.025c = 7500 km s−1. This is considerably faster than the expansion velocity of the Crab Nebula’s boundary v ≈ 2300 km s−1 (Bietenholz & Nugent 2015). However, internally the plasma speed is likely to have a gradient. For example, X-ray measurements of wisps near the termination shock in the Crab Nebula indicate velocities of 0.1c to 0.4c (Schweizer et al. 2013).
Interestingly, in the model of Kennel & Coroniti (1984) the outer radius of a PWN is expected to expand with  3. This asymptotic value is valid as long as σw ≲ 1, but it also assumes the PWN expands in vacuum rather than pushing against freely expanding supernova ejecta (cf. Chevalier & Fransson 1992, for an alternative dynamical model). Our preferred value of 0.025c implies σ ≈ 0.1. This value is at the bottom range of the values considered in Fig. 3 (light green line).
In Fig. 3 we also show the highest magnetic-field strength possible, assuming that the entire rotational energy of a maximally spinning NS (1052 ergs) is converted to the magnetic field of the plasma.
3.2. Numerical SED and MCMC parameter estimation
To further understand the nature of the underlying electron distribution, we developed a synchrotron spectrum model by integrating the single electron power-spectrum over the electron distribution function n(γ)dγ. We considered a flat (p < 2) electron distribution function affected by radiative cooling, given by
 (6)
(6)
where Ke is the normalization in energy space and γc is the break due to radiative losses (Vink 2020). In terms of the magnetic field B in Gauss and the age tyr, γc = 24.5/B2 tyr (Rybicki & Lightman 1979)4.
We calculated the synchrotron emissivity jν and absorption coefficient αν due to synchrotron self-absorption to finally arrive at the observed flux fν at a given frequency ν as  . The details of this calculation, following Rybicki & Lightman (1979) is given in Appendix B.
Ultimately, the parameter space determining the synchrotron spectrum is Θ = (R, B, tyr, p, γm, σ). We fixed γm = 10, σ = 4/3 and performed a 4 dimensional Bayesian parameter estimation using PyMultinest, a nested-sampling algorithm (Buchner 2016). We find that the radius can not be very tightly constrained within the range of 0.1 < Rpc < 0.35, while the other parameters have better limits. For the assumed σ,  G,
G,  and p = 1.112 ± 0.079. In Fig. 4, we present a few realizations from the posterior along with the data and the distribution of the parameter space.
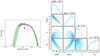 |
Fig. 4. Left: realizations of the SED from the Bayesian parameter estimation. Right: posteriors of the parameter space given by log10B, log10(tyr),p, Rpc. |
3.3. Possible implications for the engine of the persistent source
The analysis presented thus far puts constraints on magnetic-field strength and size of the progenitor, for a given magnetization parameter. These constraints provide also constraints on the total energy contained in the persistent source. For the total internal energy we have
 (7)
(7)
Using the magnetization parameter we can write
 (8)
(8)
The analysis showed that B ∼ 0.01 G, with B > 0.05 G excluded, and values B ≪ 1 mG requiring very low magnetization values. We, therefore, estimate the total energy in the source to be of order
 (9)
(9)
The current paradigm for the origin of FRBs is that they are powered by NSs, potentially magnetars. For both normal pulsars and magnetars the source of energy for the persistent source is likely to come from the rotational energy of a NS. The difference is, however, that the high surface magnetic-field of a magnetar will result in a more rapid loss of the rotational energy.
The initial rotational energy of a NS is given by
 (10)
(10)
with I the NS momentum of inertia, Ω0 = 2π/P0, the initial rotation frequency, and P0 the corresponding initial rotation period.
From this expression we see that the initial rotation period needs to have been
 (11)
(11)
The nominal value for P0 is not extremely short– it is longer than the current period of the Crab pulsar. We note that for σ ≪ 1 or R ≪ 0.35 smaller values for P0 are required. Moreover, radiative energy losses and work done by the nebula on its surroundings may require a larger input energy than is currently contained in the persistent source, and hence would require a shorter initial period. On the other hand, an initial spin period around 36 ms is at face value inconsistent with the hypothesis that the extragalactic FRBs may be powered by magnetars with unusually slower rotation periods, as proposed by Beniamini et al. (2020). It could be that the assumption that the nebula is powered by the spindown of a NS or magnetar is not correct. But it could also be that the current spin period is long, but that the nebula was created when the spin period was still ∼36 ms.
The time scale for the NS to lose this initial energy is typically
 (12)
(12)
with Bp the magnetic-field strength at the poles of the NS. For this we substituted Eq. (11) into the standard expression for τ0.
We already noted that the steepness of the radio spectrum beyond 10 GHz suggest not so much a continuous energy injection, but something that happened over a relatively short time scale compared to the age of the source. This suggest that in the context of a pulsar model τ0 ≪ tage. This allows us to put constraints on the surface magnetic field of the NS. Using Eq. (12) for τ0 with Eq. (5) for tage, we get the following constraint:
 (13)
(13)
This lower limit on Bp is consistent with values for normal young pulsars. So in principle a magnetar origin is not needed. But we note that this conclusion strongly depends on the magnetization parameter, and it should be noted that radiative energy losses, and work of the nebula on its surrounding may require a larger energy input than assumed here. It is nevertheless interesting that a magnetar as a central source is not necessarily required – but also not ruled out. This may be suprising, but note that the total energy in the persistent source Eq. (10) is not that much different from the Crab Nebula. However, the energy density is much higher due to the compactness of the source. Moreover, in our calculations we set τ0 equal to the age of the source. The steepness of the spectral break may imply τ0 ≪ tage. Setting, somewhat arbitrarily τ0 = 0.1 tage, we would require a three times stronger pulsar magnetic field.
4. Conclusions
We present low frequency observations of the persistent counterpart of FRB 121102 with the uGMRT in 400, 610, 1260, and 1390 MHz frequencies. We detect an optically thin spectral energy distribution down to 400 MHz, with a flat spectral index similar to that of Galactic plerions. Using a generic synchrotron spectral model, we obtain constraints on the magnetic-field energy density, radius, and age of the emitting plasma. We also constructed a numerical synchrotron SED and estimated the parameters through a Bayesian algorithm, and arrived at more robust constraints on R, B, tyr, and p. Our conclusions are sensitive to the magnetization parameter, σ, and also assume that the spectral break at ∼10 GHz is due to radiative losses. With these assumptions in mind, we list here our main conclusions:
-
Based on the absence of synchrotron self-absorption, and using energetic constraints, we arrive at upper limits for magnetic field and magnetization of the emitting region, B < 0.05 G and σ < 100 respectively.
-
For reasonable values of σ the inferred magnetic field is ∼0.01 G.
-
Constraints on the age of the source are
 , from assuming the spectral break at 9.2 GHz to be due to radiative losses.
 -
We see that the emission region has a low σ and is also expanding nonrelativistically (< 0.025c). The slow expansion speed is consistent with the observed absence of systematic variations in the radio flux.
-
Similar to Galactic PWNe, most of the energy in the persistent source is carried by leptons, and not by the magnetic field. This is similar to the Crab Nebula. However, this source has about three orders of magnitude stronger B-field in comparison with the Crab nebula. Moreover, it appears much younger, and the sharp break in frequency suggests a sharper decline in injection of electrons.
-
Assuming the rotational energy of the central NS to be responsible for the energy in the nebula, we obtained limits on its initial period to be shorter than ∼36 ms.
-
As the observed radio spectrum with its steep break implies a short energy injection time-scale, the characteristic age of the NS has to be smaller than the age of the nebula, and hence the limiting magnetic field of the NS is constrained to be Bp > 4.5 × 10¹² G. This result, obtained purely using the radio spectrum of the persistent source suggests that while a magnetar is not ruled out, it is also not necessarily required.
These conclusions are based on the properties of the persistent radio source associated with FRB 121102. The connection between Galactic and extragalactic FRBs provide an important argument to prefer a magnetar origin for both the creation of the nebula and the FRBs from FRB 121102. If one accepts that FRB 121102 is powered by a magnetar, the energetics of the nebula as derived here, provides new arguments for the debate on the initial spin-periods with which magnetars are created (Vink & Kuiper 2006; Rogers & Safi-Harb 2016; Beniamini et al. 2019; Zhou et al. 2019). A P0 ∼ 36 ms, suggests yet again that most magnetars are not necessarily created as a result of very short initial spin periods (≲2 ms, Duncan & Thompson 1992), but it also suggests that at least not all magnetars are born with long periods (P ≳ 0.1 s).
Under 32_123, PI Resmi Lekshmi for legacy-GMRT and under ddtB299, Resmi Lekshmi & Ishwara-Chandra for uGMRT.
We assumed here that the minimum frequency for synchrotron radiation, corresponding to the lower limit of the electron energy distribution, is much less than the observed spectrum/synchrotron-self absorption break (e.g., Sari et al. 1998). For Galactic PWNe, in particular the Crab Nebula, such a lower limit has, surprisingly (Lyubarsky 2005), never been identified. This is a subtle point, made here for completeness sake, given that we report here that there is no evidence for a low-frequency break, whether due to self-absorption or a low-energy cutoff.
Here we have used σ in the nebula, not the unshocked wind value σw = 4σ (Vink 2020) as used by Kennel & Coroniti (1984).
Radiative losses are a combination of synchrotron radiation losses and losses due to inverse Compton scattering–the latter includes synchrotron- self-Compton losses. For the present case the synchrotron losses dominate, as the local energy density is dominated by the magnetic-field energy density, uB = B2/8π = 10−4(B/0.01 G)2 erg cm−3, whereas the local radiation energy density is approximately uR ≈ L/cR2 ≈ 10−9(νLν/3 × 1039 erg s−1) erg cm−3.
Acknowledgments
This work is partially funded by the Dept. of Science and Technology, India, grant EMR2016/007127. R.L. thanks J. W. T. Hessels, D. Bhattacharya, R. Dastidar, K. Misra, and Benjamin Stappers for stimulating discussions at various stages of this work.
References
- Amiri, M., Bandura, K., Bhardwaj, M., et al. 2019, Nature, 566, 235 [NASA ADS] [CrossRef] [Google Scholar]
- Bannister, K. W., Deller, A. T., Phillips, C., et al. 2019, Science, 365, 565 [NASA ADS] [CrossRef] [Google Scholar]
- Bassa, C., Tendulkar, S. P., Adams, E. A. K., et al. 2017, ApJ, 843, L8 [NASA ADS] [CrossRef] [Google Scholar]
- Beloborodov, A. M. 2017, ApJ, 843, L26 [NASA ADS] [CrossRef] [Google Scholar]
- Beniamini, P., Hotokezaka, K., van der Horst, A., & Kouveliotou, C. 2019, MNRAS, 487, 1426 [NASA ADS] [CrossRef] [Google Scholar]
- Beniamini, P., Wadiasingh, Z., & Metzger, B. D. 2020, MNRAS, 496, 3390 [NASA ADS] [CrossRef] [Google Scholar]
- Bietenholz, M. F., & Nugent, R. L. 2015, MNRAS, 454, 2416 [NASA ADS] [CrossRef] [Google Scholar]
- Blandford, R. D., & Königl, A. 1979, ApJ, 232, 34 [Google Scholar]
- Bochenek, C. D., Ravi, V., Belov, K. V., et al. 2020, Nature, 587, 59 [NASA ADS] [CrossRef] [Google Scholar]
- Buchner, J. 2016, Astrophysics Source Code Library [record ascl:1606.005] [Google Scholar]
- Chatterjee, S., Law, C. J., Wharton, R. S., et al. 2017, Nature, 541, 58 [NASA ADS] [CrossRef] [Google Scholar]
- Chevalier, R. A., & Fransson, C. 1992, ApJ, 395, 540 [NASA ADS] [CrossRef] [Google Scholar]
- CHIME/FRB Collaboration (Andersen, B., et al.) 2019a, ApJ, 885, L24 [NASA ADS] [CrossRef] [Google Scholar]
- CHIME/FRB Collaboration (Amiri, M., et al.) 2019b, Nature, 566, 230 [NASA ADS] [CrossRef] [Google Scholar]
- CHIME/FRB Collaboration (Andersen, B. C., et al.) 2020, Nature, 587, 54 [Google Scholar]
- Cordes, J. M., & Chatterjee, S. 2019, ARA&A, 57, 417 [NASA ADS] [CrossRef] [Google Scholar]
- Cotton, W. D., Wittels, J. J., Shapiro, I. I., et al. 1980, ApJ, 238, L123 [NASA ADS] [CrossRef] [Google Scholar]
- Dai, Z., Wang, J., & Yu, Y. 2017, ApJ, 838, L7 [CrossRef] [Google Scholar]
- Duncan, R. C., & Thompson, C. 1992, ApJ, 392, L9 [Google Scholar]
- Fonseca, E., Andersen, B. C., Bhardwaj, M., et al. 2020, ApJ, 891, L6 [NASA ADS] [CrossRef] [Google Scholar]
- Katz, J. 2016, ApJ, 826, 226 [CrossRef] [Google Scholar]
- Kennel, C. F., & Coroniti, F. V. 1984, ApJ, 283, 710 [Google Scholar]
- Kothes, R. 2017, in Radio Properties of Pulsar Wind Nebulae, ed. D. F. Torres, 446, 1 [NASA ADS] [Google Scholar]
- Kulkarni, S. R., Ofek, E. O., Neill, J. D., Zheng, Z., & Juric, M. 2014, ApJ, 797, 70 [NASA ADS] [CrossRef] [Google Scholar]
- Kumar, P., Lu, W., & Bhattacharya, M. 2017, MNRAS, 468, 2726 [NASA ADS] [CrossRef] [Google Scholar]
- Kumar, P., Shannon, R. M., Osłowski, S., et al. 2019, ApJ, 887, L30 [NASA ADS] [CrossRef] [Google Scholar]
- Longair, M. S. 2011, High Energy Astrophysics (Cambridge: Cambridge University Press) [Google Scholar]
- Lorimer, D. R., Bailes, M., McLaughlin, M. A., Narkevic, D. J., & Crawford, F. 2007, Science, 318, 777 [Google Scholar]
- Lu, W., & Kumar, P. 2018, MNRAS, 477, 2470 [Google Scholar]
- Lu, W., Kumar, P., & Zhang, B. 2020, MNRAS, 498, 1397 [NASA ADS] [CrossRef] [Google Scholar]
- Lyubarsky, Y. 2005, in X-Ray and Radio Connections, eds. L. O. Sjouwerman, & K. K. Dyer, 5.02 [Google Scholar]
- Lyubarsky, Y. 2014, MNRAS, 442, L9 [Google Scholar]
- Macquart, J.-P., Prochaska, J. X., McQuinn, M., et al. 2020, Nature, 581, 391 [Google Scholar]
- Marcote, B., Paragi, Z., Hessels, J. W. T., et al. 2017, ApJ, 834, L8 [CrossRef] [Google Scholar]
- Margalit, B., Beniamini, P., Sridhar, N., & Metzger, B. D. 2020, ApJ, 899, L27 [NASA ADS] [CrossRef] [Google Scholar]
- Metzger, B. D., Berger, E., & Margalit, B. 2017, ApJ, 841, 14 [NASA ADS] [CrossRef] [Google Scholar]
- Mondal, S., Bera, A., Chandra, P., & Das, B. 2020, MNRAS, 498, 3863 [NASA ADS] [CrossRef] [Google Scholar]
- Murase, K., Kashiyama, K., & Mészáros, P. 2016, MNRAS, 461, 1498 [NASA ADS] [CrossRef] [Google Scholar]
- Murphy, E. J., Condon, J. J., Schinnerer, E., et al. 2011, ApJ, 737, 67 [Google Scholar]
- Murphy, E. J., Momjian, E., Condon, J. J., et al. 2017, ApJ, 839, 35 [Google Scholar]
- Nicholl, M., Williams, P. K. G., Berger, E., et al. 2017, ApJ, 843, 84 [NASA ADS] [CrossRef] [Google Scholar]
- Petroff, E., Hessels, J., & Lorimer, D. 2019, A&ARv, 27, 4 [NASA ADS] [CrossRef] [Google Scholar]
- Piro, A. L. 2016, ApJ, 824, L32 [CrossRef] [Google Scholar]
- Platts, E., Weltman, A., Walters, A., et al. 2019, Phys. Rep., 821, 1 [NASA ADS] [CrossRef] [Google Scholar]
- Popov, S., & Postnov, K. 2013, ArXiv e-prints [arXiv:1307.4924] [Google Scholar]
- Prochaska, J. X., Macquart, J.-P., McQuinn, M., et al. 2019, Science, 366, 231 [NASA ADS] [CrossRef] [Google Scholar]
- Ravi, V., Catha, M., D’Addario, L., et al. 2019, Nature, 572, 352 [NASA ADS] [CrossRef] [Google Scholar]
- Rogers, A., & Safi-Harb, S. 2016, MNRAS, 457, 1180 [NASA ADS] [CrossRef] [Google Scholar]
- Rosero, V., Hofner, P., Claussen, M., et al. 2016, ApJS, 227, 25 [Google Scholar]
- Rybicki, G. B., & Lightman, A. P. 1979, Radiative Processes in Astrophysics (New York: Wiley Interscience) [Google Scholar]
- Sari, R., Piran, T., & Narayan, R. 1998, ApJ, 497, L17 [Google Scholar]
- Schweizer, T., Bucciantini, N., Idec, W., et al. 2013, MNRAS, 433, 3325 [NASA ADS] [CrossRef] [Google Scholar]
- Spitler, L., Cordes, J. M., Hessels, J. W. T., et al. 2014, ApJ, 790, 101 [NASA ADS] [CrossRef] [Google Scholar]
- Spitler, L. G., Scholz, P., Hessels, J. W. T., et al. 2016a, Nature, 531, 202 [NASA ADS] [CrossRef] [Google Scholar]
- Spitler, L., Scholz, P., Hessels, J., et al. 2016b, Nature, 531, 202 [NASA ADS] [CrossRef] [Google Scholar]
- Thornton, D., Stappers, B., Bailes, M., et al. 2013, Science, 341, 53 [NASA ADS] [CrossRef] [Google Scholar]
- Vink, J. 2020, Physics and Evolution of Supernova Remnants (Berlin: Springer) [CrossRef] [Google Scholar]
- Vink, J., & Kuiper, L. 2006, MNRAS, 370, L14 [NASA ADS] [CrossRef] [Google Scholar]
- Waxman, E. 2017, ApJ, 842, 34 [NASA ADS] [CrossRef] [Google Scholar]
- Weiler, K. W., Panagia, N., Sramek, R. A., et al. 2010, Mem. Soc. Astron. It., 81, 374 [NASA ADS] [Google Scholar]
- Yang, Y.-H., & Dai, Z.-G. 2019, ApJ, 885, 149 [NASA ADS] [CrossRef] [Google Scholar]
- Zhou, P., Vink, J., Safi-Harb, S., & Miceli, M. 2019, A&A, 629, A51 [NASA ADS] [CrossRef] [EDP Sciences] [Google Scholar]
Appendix A: Normalization of the electron distribution
In section 3.1, we have used the normalization Ke of the electron distribution in terms of the observed luminosity at the break νb. Below, we provide the derivation for the same.
Ke is defined through the density of electrons n = KeE−p, where E is the energy of the electron given as γmec2.
The total luminosity of a synchrotron source, with an electron distribution extending from γm to γM can be written as
 (A.1)
(A.1)
where V is the volume of the source, Psyn(γ) is the synchrotron power radiated by an electron of Lorentz factor γ and n(γ) is the electron distribution function ( equals the number density of electrons).
Using V = (4/3)πR3,  , one can rewrite the above equation as,
 (A.2)
(A.2)
For deriving this expression, we have once again assumed that γM ≫ γm and ignored a  term in the integration.
The total luminosity Lsyn can be approximately re-written as Lνbνb. With this substitution, one can arrive at equation-3.
The energy density in nonthermal electrons,  can be rewritten as,
 (A.3)
(A.3)
after using νb = νsyn(γM).
Appendix B: Expressions used in section 3.2
In this section, we describe the steps followed in constructing the numerical synchrotron SED starting from the single electron power-spectrum. We have followed the method in Rybicki & Lightman (1979). The single electron power-spectrum Pν, γ is  where F(x) is
  , K5/3 is the modified-Bessel function of 5/3rd order, and x is the normalized frequency ν/νsyn(γ). We obtain the emissivity jν by integrating the power per unit solid angle Pν, γ/(4π) with the electron distribution function given in 6. To estimate the optical depth τν, we used the expression of the absorption coefficient
 ![Mathematical equation: $ \alpha_{\nu} =\frac{\sqrt{3} e^3}{8 \pi m_{\mathrm{e}}} \left( \frac{3 e}{2 \pi m_{\mathrm{e}}^3 c^5} \right)^{p/2} K_{\mathrm{e}} \Gamma\left[ \frac{ep+22}{12}\right] \Gamma\left[ \frac{3p+2}{12}\right] B^{(p+2)/2} \nu^{-(p+4)/2} $](/articles/aa/full_html/2021/11/aa39771-20/aa39771-20-eq33.gif) . Normalization Ke of the electron energy distribution function is re-written in terms of the energy density ue in nonthermal electrons as Ke = (2 − p)ue(γMmec2)p − 2. As we have assumed in section 3.1, we then considered the energy densities ue and uB to be related through an arbitrary magnetization parameter σ to finally write αν in terms of B, γM, p, and σ. The final observed flux is calculated as
. Normalization Ke of the electron energy distribution function is re-written in terms of the energy density ue in nonthermal electrons as Ke = (2 − p)ue(γMmec2)p − 2. As we have assumed in section 3.1, we then considered the energy densities ue and uB to be related through an arbitrary magnetization parameter σ to finally write αν in terms of B, γM, p, and σ. The final observed flux is calculated as  .
.
All Tables
All Figures
|
Fig. 1. uGMRT contour maps of the central portion of the field. The synthesized beam is shown in the lower-left corner. The FRB position from Chatterjee et al. (2017) is shown as black cross. Left: band-3 map, with contour levels at (3, 4, 5)×34 μJy. Right: band-5 contours having levels of (4, 5, 10, 15, 20, 25)×13 μJy. |
| In the text | |
|
Fig. 2. Fit to the near-simultaneous SED of the persistent source by an empirical double power-law model. |
| In the text | |
|
Fig. 3. Constraints on the parameters of the emitting plasma from available observations. Minimum energy requirements and the optically thin radio SED together restricts the allowed region in the plane of magnetic field (B) and radius (R). Considering the spectral break at 9.2 GHz to be due to synchrotron cooling, B can be translated to the age of the source (second y-axis). The magenta solid line and the shaded region correspond to self-absorption frequency, νa ≤ 400 MHz. The thick solid lines in shades of green represent B versus R relation resulting from the minimum energy argument for different values of the magnetization parameter σ (see text for details). The sensitivity on the electron energy spectral index is not high and we have used p = 1.2 in this calculation. The thin green line corresponds to the highest magnetic field possible, if 1052 ergs of magnetar rotational energy is converted to magnetic fields. Dashed lines in shades of blue result from equating the age obtained through synchrotron cooling with R/v, where v is assumed expansion velocity. VLBI upper limit on the radius of the source is indicated with a black arrow. |
| In the text | |
|
Fig. 4. Left: realizations of the SED from the Bayesian parameter estimation. Right: posteriors of the parameter space given by log10B, log10(tyr),p, Rpc. |
| In the text | |
Current usage metrics show cumulative count of Article Views (full-text article views including HTML views, PDF and ePub downloads, according to the available data) and Abstracts Views on Vision4Press platform.
Data correspond to usage on the plateform after 2015. The current usage metrics is available 48-96 hours after online publication and is updated daily on week days.
Initial download of the metrics may take a while.