Fig. 5.
Download original image
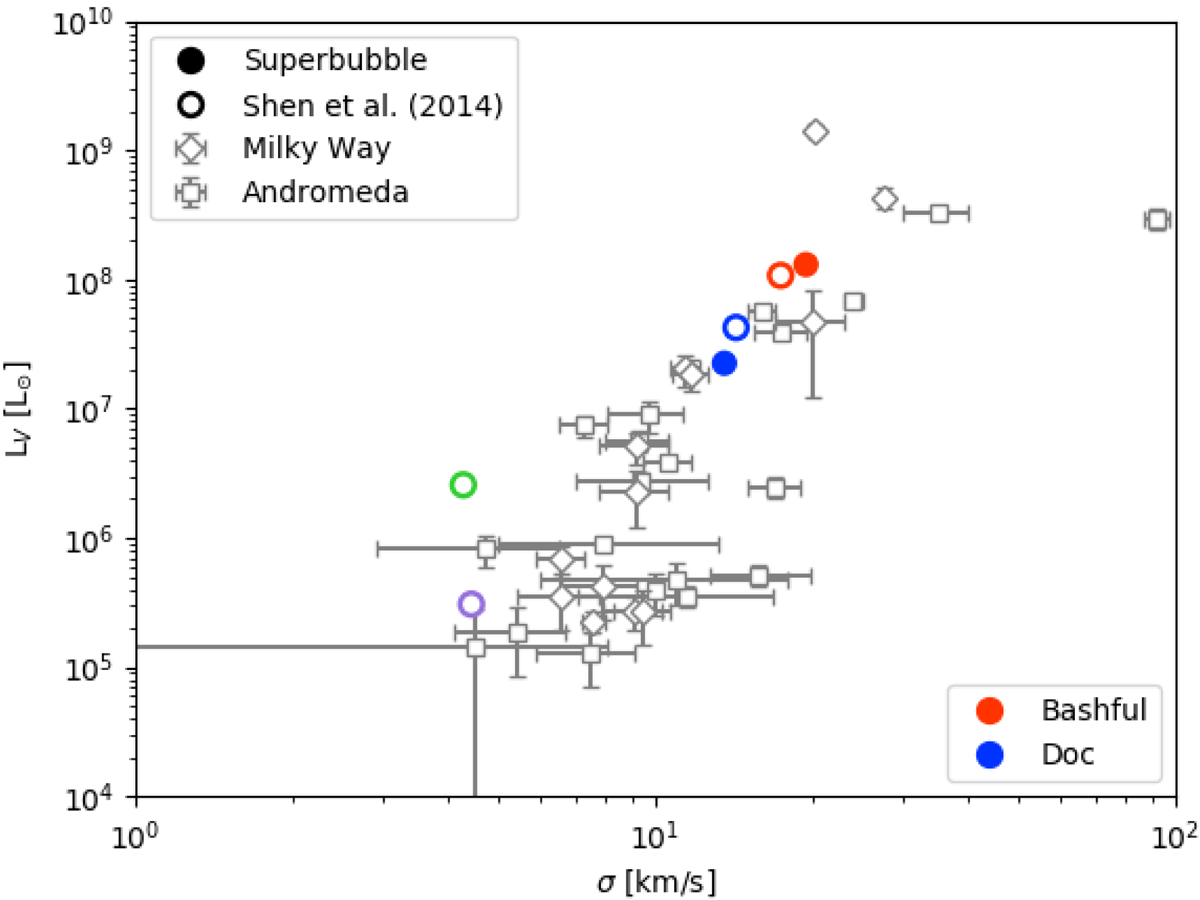
V-band luminosity versus stellar 1D line-of-sight velocity dispersion of the two simulated dwarfs. The V-band luminosity was computed using the Padova simple stellar populations models (Marigo et al. 2008; Girardi et al. 2010). The filled coloured circles represent Bashful (red) and Doc (blue) in our simulation. The empty circles with coloured edges correspond to Bashful (red), Doc (blue), Dopey (purple) and Grumpy (green) simulated in Shen et al. (2014), with the blastwave feedback model. The empty symbols show the observed LV − σ relation for satellite galaxies of the Milky Way (diamonds) and Andromeda (squares), from the original sample of Local Group galaxies published by McConnachie (2012).
Current usage metrics show cumulative count of Article Views (full-text article views including HTML views, PDF and ePub downloads, according to the available data) and Abstracts Views on Vision4Press platform.
Data correspond to usage on the plateform after 2015. The current usage metrics is available 48-96 hours after online publication and is updated daily on week days.
Initial download of the metrics may take a while.