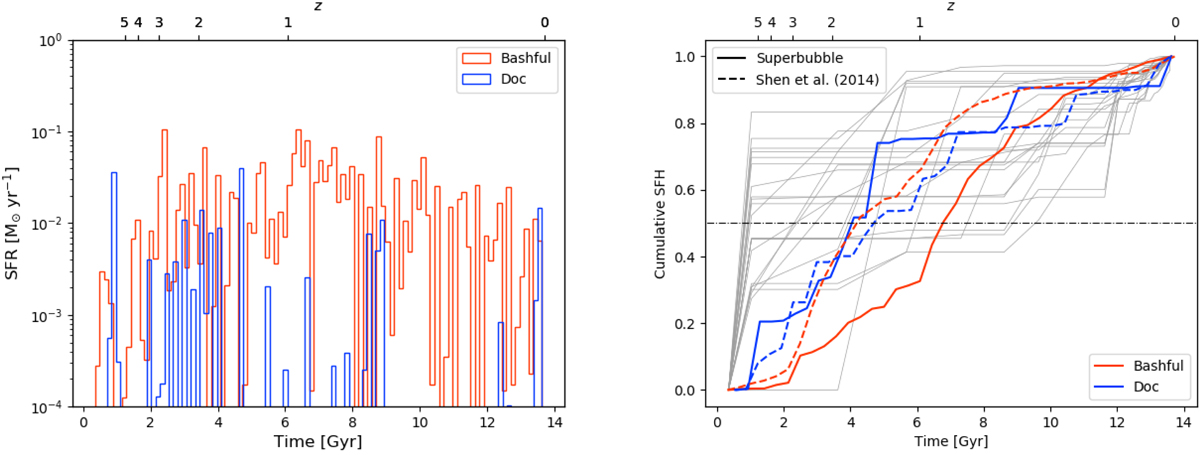
Fig. 3.
Download original image
Left panel: star formation history of Bashful (red) and Doc (blue), averaged a over time intervals of 140 Myr. Right panel: cumulative star formation history of the simulated dwarf galaxies, with total stellar mass normalised to unity. The solid coloured lines represent Bashful (red) and Doc (blue) in our simulation, while the dashed coloured lines correspond, with the same colours, to the dwarfs galaxies simulated in Shen et al. (2014). The grey solid lines are the cumulative star formation histories of individual dwarf irregulars in the ANGST sample (Weisz et al. 2011).
Current usage metrics show cumulative count of Article Views (full-text article views including HTML views, PDF and ePub downloads, according to the available data) and Abstracts Views on Vision4Press platform.
Data correspond to usage on the plateform after 2015. The current usage metrics is available 48-96 hours after online publication and is updated daily on week days.
Initial download of the metrics may take a while.