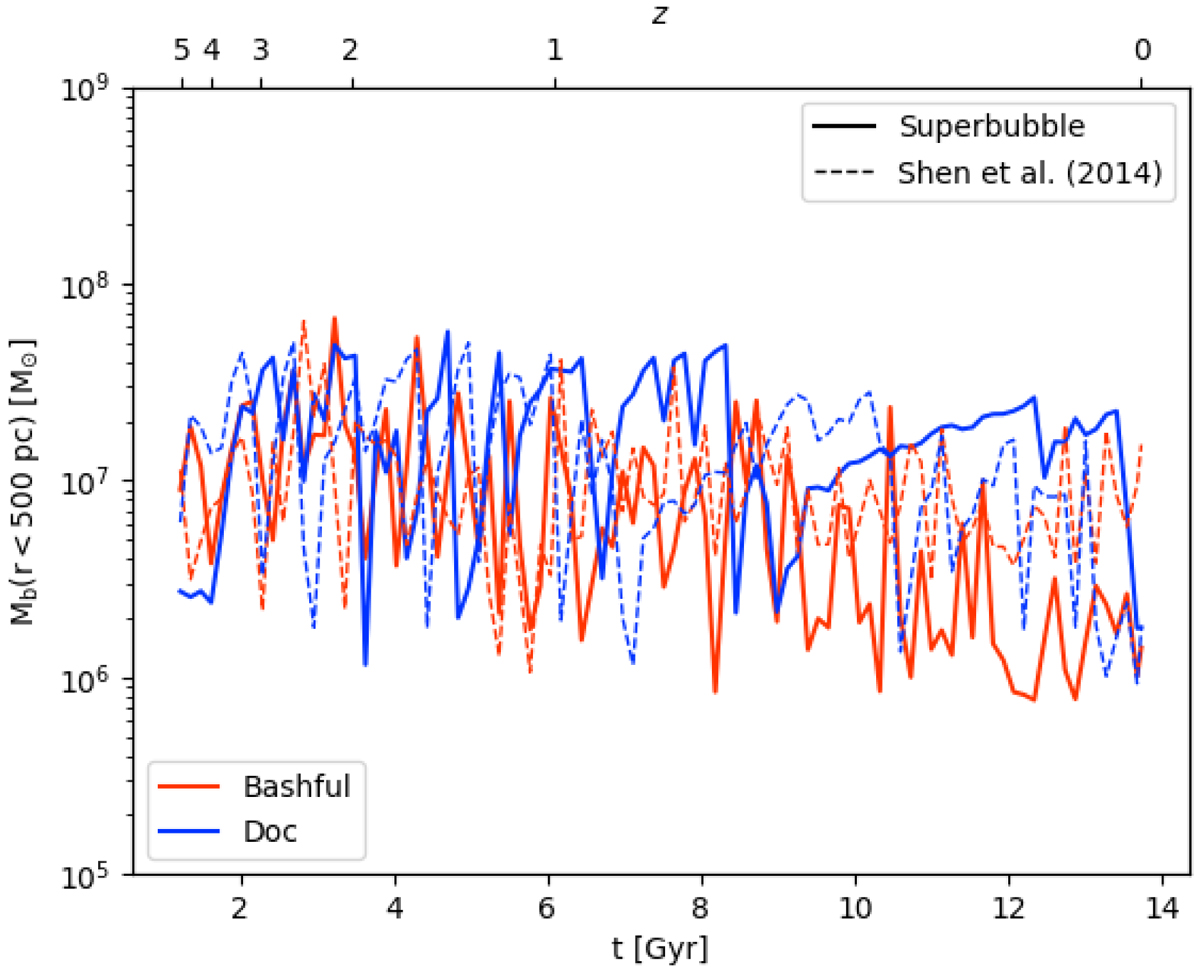
Fig. 10.
Download original image
Temporal evolution of the total baryonic mass enclosed within 500 pc from the centre of the two simulated dwarfs. The solid lines correspond to Bashful (red) and Doc (blue) in our simulation, with the superbubble feedback model. With the same colour convention, the same two dwarfs analysed in Shen et al. (2014) and Madau et al. (2014) are represented with dashed lines.
Current usage metrics show cumulative count of Article Views (full-text article views including HTML views, PDF and ePub downloads, according to the available data) and Abstracts Views on Vision4Press platform.
Data correspond to usage on the plateform after 2015. The current usage metrics is available 48-96 hours after online publication and is updated daily on week days.
Initial download of the metrics may take a while.