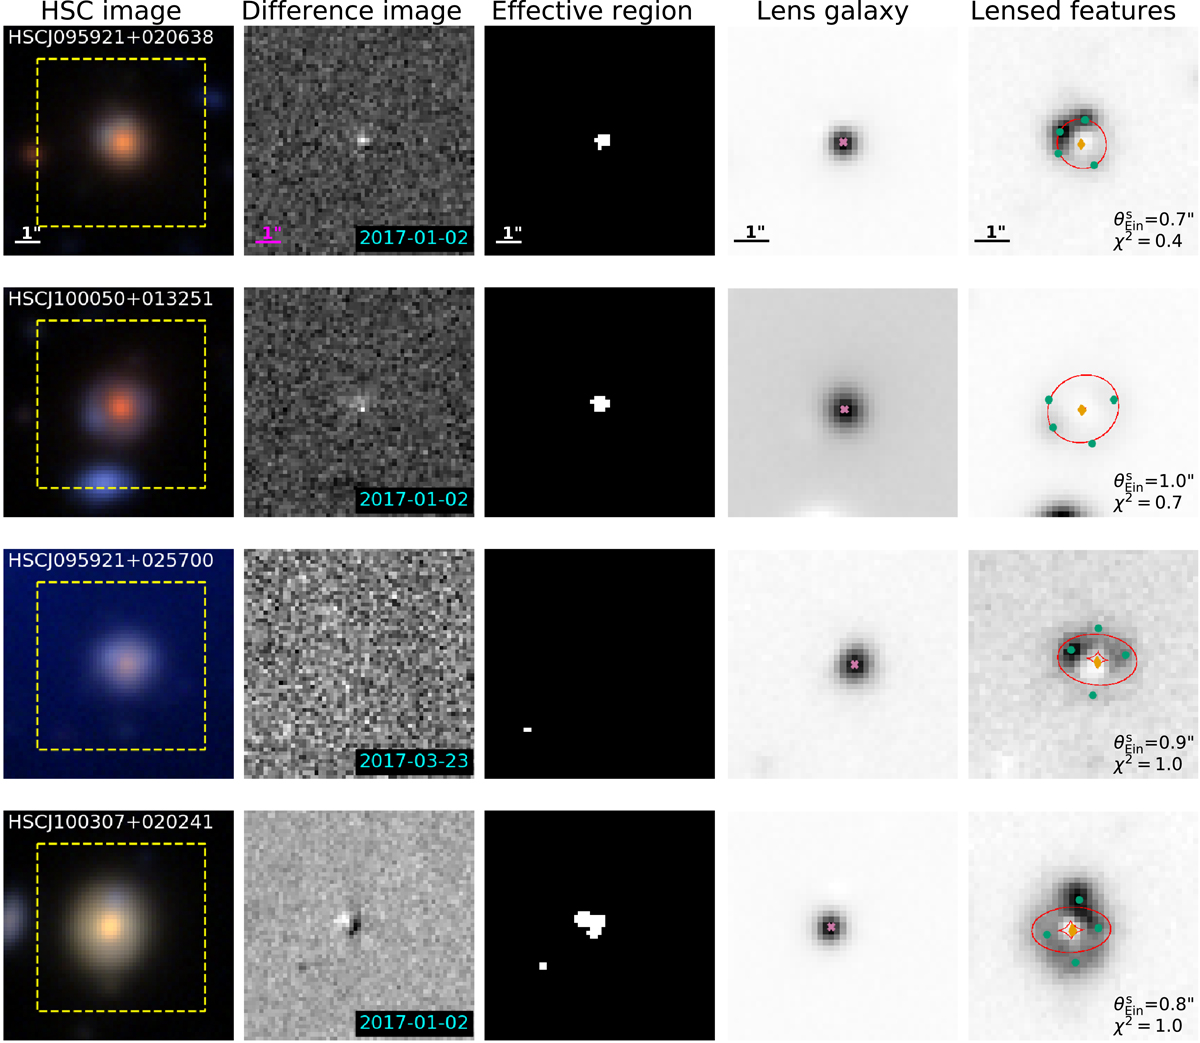
Fig. 1.
Download original image
Final candidates, the variable objects identified as lensed quasars by both the variability-based method and CHITAH with average scores higher than 1.5 from the visual inspection. The first column shows the gri image of each final candidate. The second column shows their difference images at the epoch at which they met the time variability selection criteria, and the third column shows their corresponding effective region, a quantification of the object’s spatial extent in the difference image. The fourth column shows the lens galaxy predicted by CHITAH with the lens centre marked by the magenta cross. The fifth column shows their predicted lensed features by CHITAH with their best-fit SIE model. The positions of the fitted lensed images are in green dots, the predicted source position is labelled as the yellow diamond, and the red curves are the critical and caustic curves of their best-fit SIE model. The variability-based selection uses cutouts of 10″ × 10″ (first three columns), and CHITAH uses cutouts of 7″ × 7″, which is the yellow dashed box in the first column.
Current usage metrics show cumulative count of Article Views (full-text article views including HTML views, PDF and ePub downloads, according to the available data) and Abstracts Views on Vision4Press platform.
Data correspond to usage on the plateform after 2015. The current usage metrics is available 48-96 hours after online publication and is updated daily on week days.
Initial download of the metrics may take a while.