Open Access
Fig. 5.
Download original image
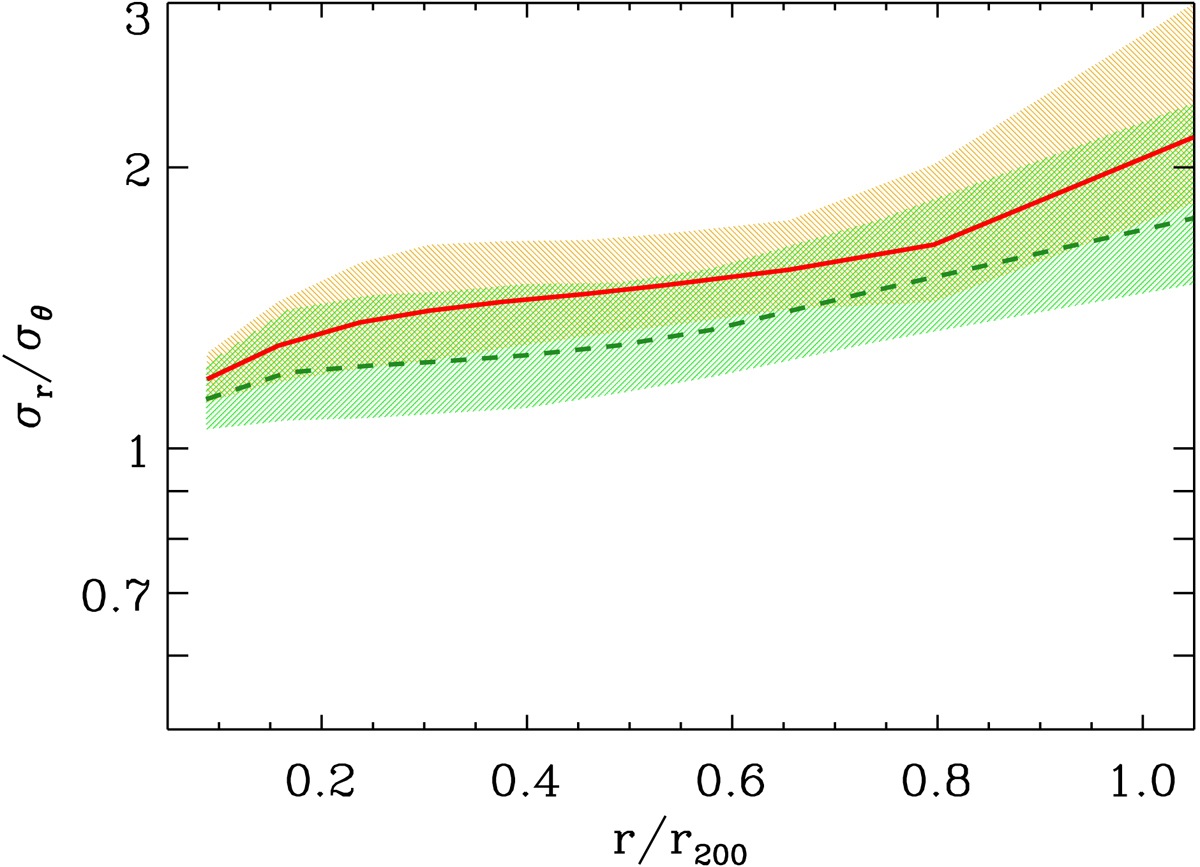
Velocity anisotropy profile σr/σθ and 1σ confidence regions for the systems with Δm12 > 1.5. Solid red line and orange shading: based on all 20 systems (same as bottom-right panel in Fig. 3); dashed green line and green shading: based on 17 systems, excluding the three richest.
Current usage metrics show cumulative count of Article Views (full-text article views including HTML views, PDF and ePub downloads, according to the available data) and Abstracts Views on Vision4Press platform.
Data correspond to usage on the plateform after 2015. The current usage metrics is available 48-96 hours after online publication and is updated daily on week days.
Initial download of the metrics may take a while.