Fig. 3.
Download original image
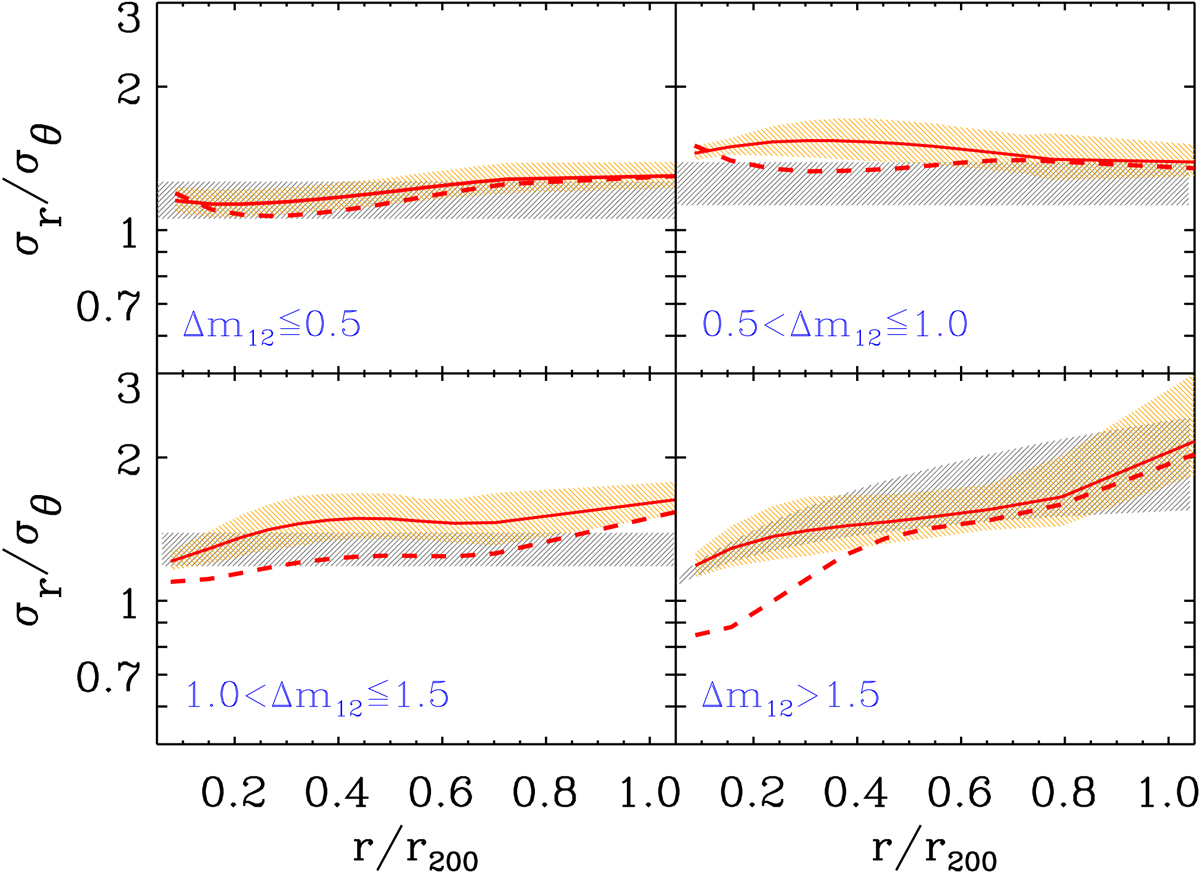
Red solid curves and orange shadings: Velocity anisotropy profile σr/σθ and 1σ confidence regions (estimated from 100 bootstrap resampling) for the four samples, obtained from the Jeans equation inversion using the minimum-BIC MAMPOSSt M(r) (see Table 2). The dashed red curves indicate the solutions obtained including galaxies in the central < 0.05 Mpc regions. For comparison, the grey shading reproduces the 1σ confidence regions of the MAMPOSSt solutions shown in Fig. 2. Top-left panel: systems with Δm12 ≤ 0.5. Top-right panel: systems with 0.5 < Δm12 ≤ 1.0. Bottom-left panel: systems with 1.0 < Δm12 ≤ 1.5. Bottom-right panel: systems with Δm12 > 1.5.
Current usage metrics show cumulative count of Article Views (full-text article views including HTML views, PDF and ePub downloads, according to the available data) and Abstracts Views on Vision4Press platform.
Data correspond to usage on the plateform after 2015. The current usage metrics is available 48-96 hours after online publication and is updated daily on week days.
Initial download of the metrics may take a while.