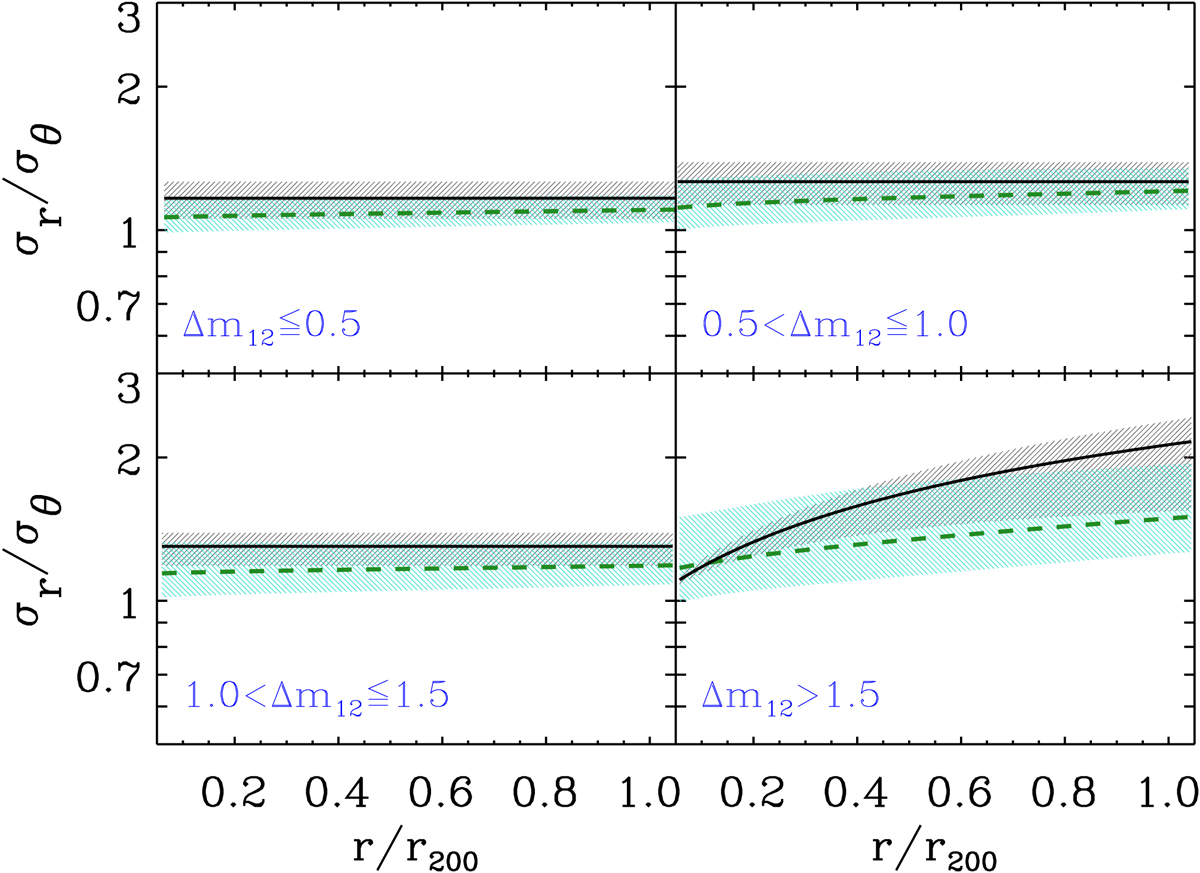
Fig. 2.
Download original image
MAMPOSSt estimates of the velocity anisotropy profile, σr/σθ, for the four samples. Black curve and grey shading: Minimum-BIC solution and 1σ confidence region estimated by the MCMC analysis. Green dashed curve and turquoise shading: Weighted average and dispersion of the MAMPOSSt results from all different combinations of M(r) and β(r) models, using the MAMPOSSt likelihoods as weights (see also Table 2). Top-left panel: systems with Δm12 ≤ 0.5. Top-right panel: systems with 0.5 < Δm12 ≤ 1.0. Bottom-left panel: systems with 1.0 < Δm12 ≤ 1.5. Bottom-right panel: systems with Δm12 > 1.5.
Current usage metrics show cumulative count of Article Views (full-text article views including HTML views, PDF and ePub downloads, according to the available data) and Abstracts Views on Vision4Press platform.
Data correspond to usage on the plateform after 2015. The current usage metrics is available 48-96 hours after online publication and is updated daily on week days.
Initial download of the metrics may take a while.