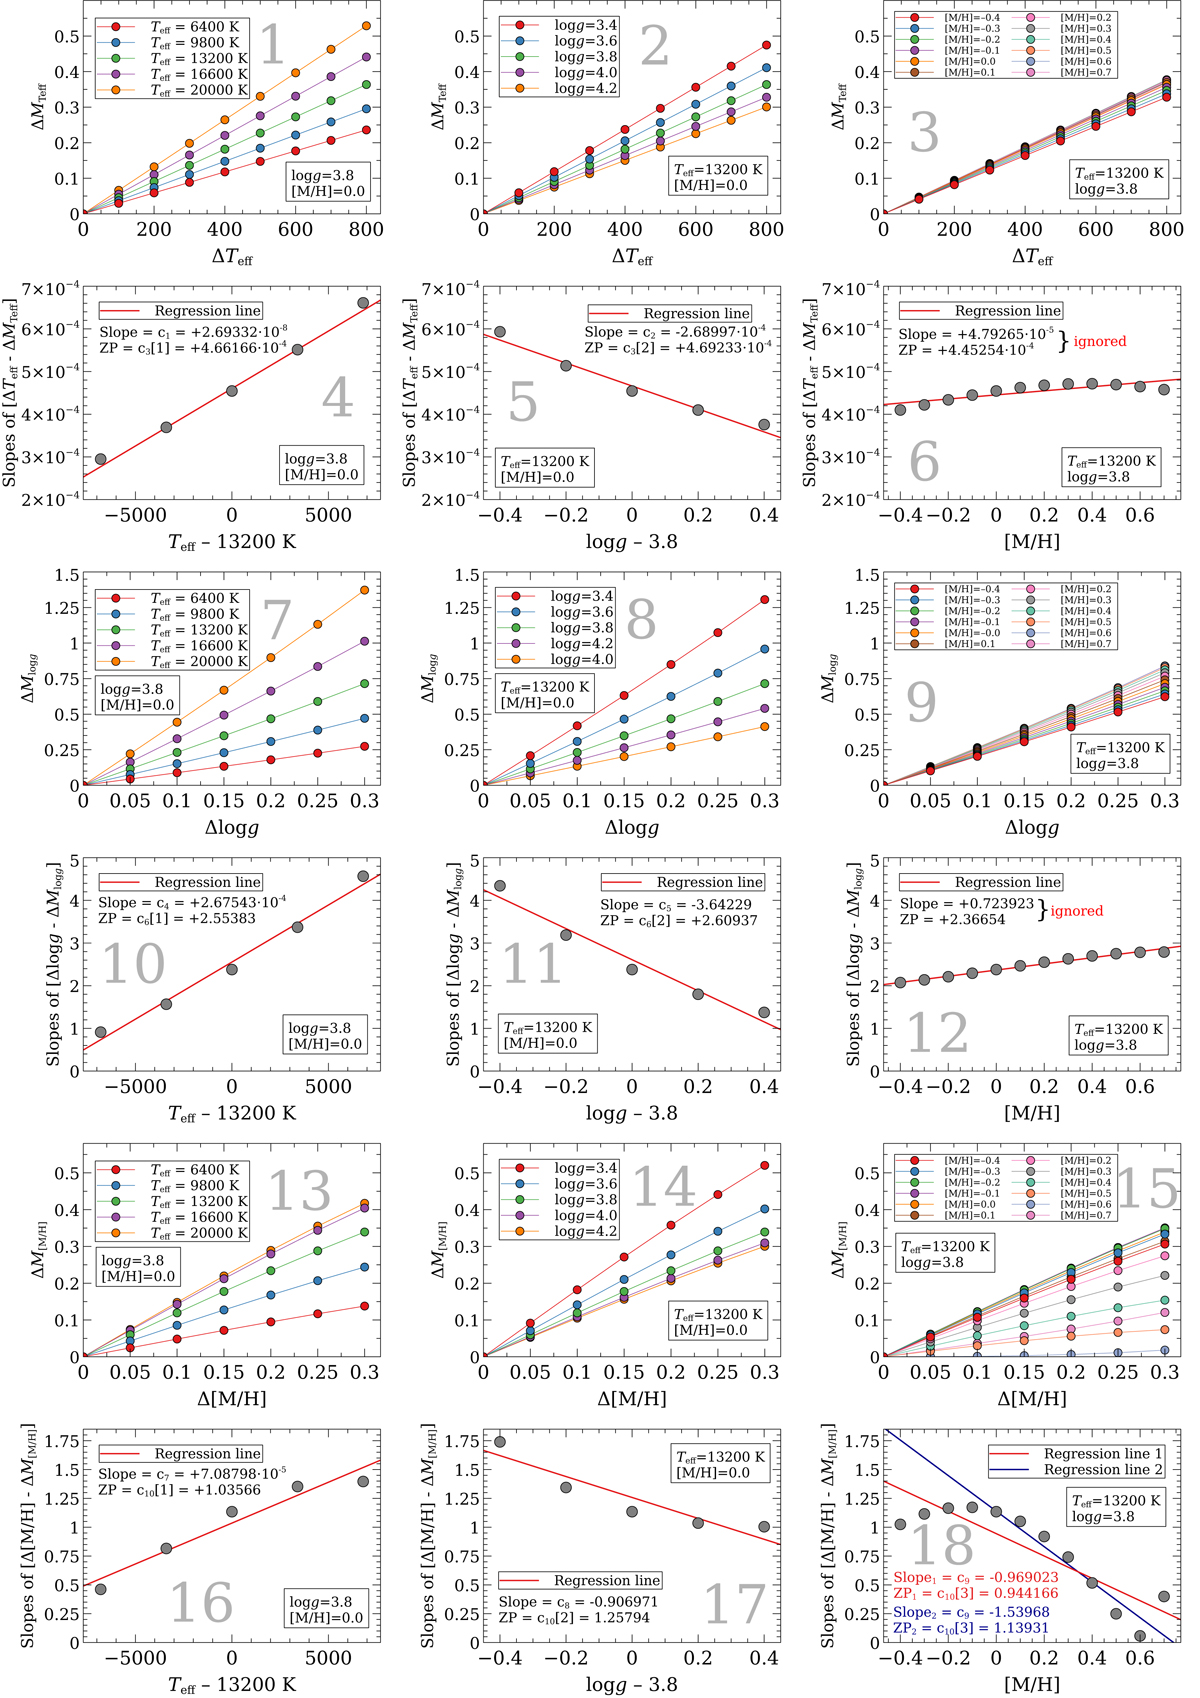
Fig. B.2.
Download original image
Regression analysis and calculating the coefficients in the uncertainty estimation formula for the MTGR with the metallicity-dependent coefficients. The slopes in graphs 6 and 12 were too small and ignored (see text). Two solutions were provided for c9 and c10: Regression line 1 is for the entire [M/H] range, and regression line 2 is a better estimate for −0.1 ≤ [M/H] ≤ 0.6. The zero points (ZPs) c3, c6, and c10 were calculated by averaging the individual calculations, i.e., c3 = (c3[1]+c3[2])/2, c6 = (c6[1]+c6[2])/2, and c10 = (c10[1]+c10[2]+c10[3])/3.
Current usage metrics show cumulative count of Article Views (full-text article views including HTML views, PDF and ePub downloads, according to the available data) and Abstracts Views on Vision4Press platform.
Data correspond to usage on the plateform after 2015. The current usage metrics is available 48-96 hours after online publication and is updated daily on week days.
Initial download of the metrics may take a while.