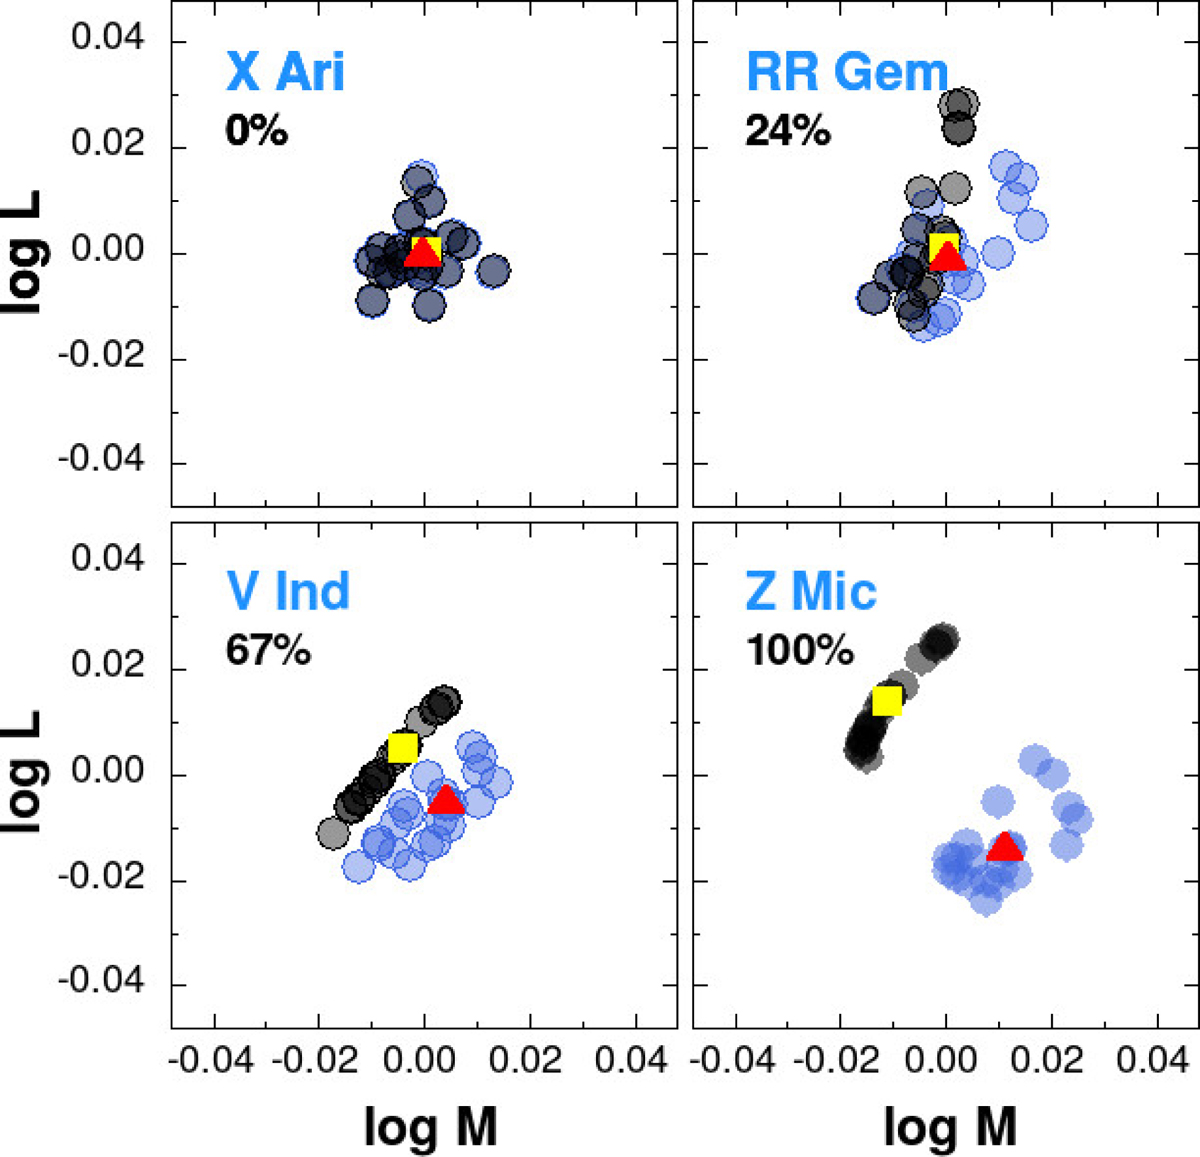
Fig. 4.
Download original image
Examples of the solution types from the HB and LNA models. Filled circles show the closest (M, L) pairs of the two types of models from 20 random realizations with the errors of V, Ks, [Fe/H], E(B − V), and parallax, centered around their observed values. Gray and blue coloring is used for the HB and LNA models, respectively. The closest values at the observed parameters are shown by yellow squares for the HB models and by red triangles for the LNA models. The odds of being a DK are shown under the variable names.
Current usage metrics show cumulative count of Article Views (full-text article views including HTML views, PDF and ePub downloads, according to the available data) and Abstracts Views on Vision4Press platform.
Data correspond to usage on the plateform after 2015. The current usage metrics is available 48-96 hours after online publication and is updated daily on week days.
Initial download of the metrics may take a while.