Fig. 4
Download original image
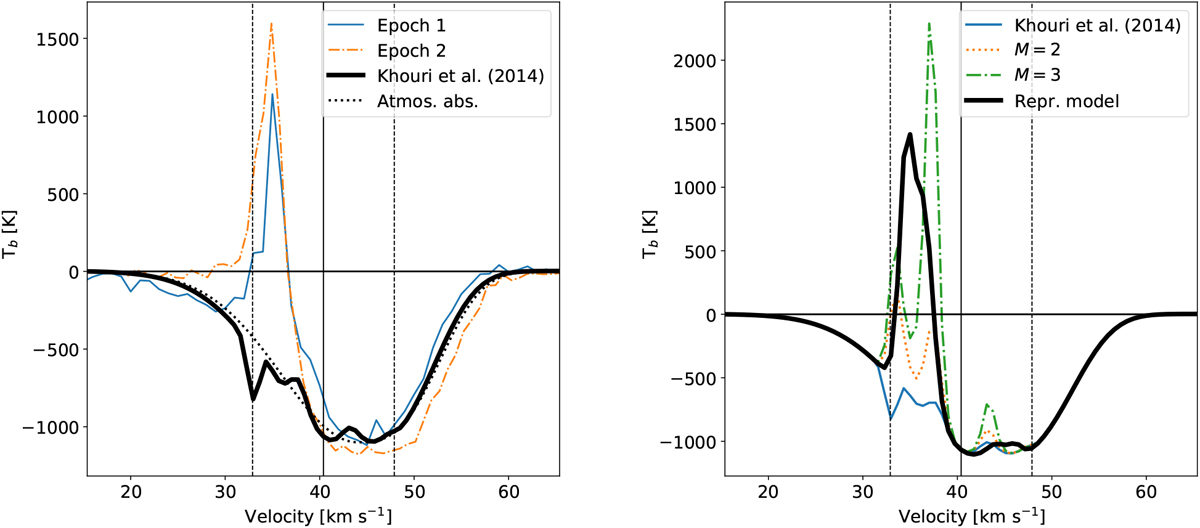
Spectra of the CO J = 3−2 emission and the result of radiative transfer models. Left: thin lines indicate the CO emission at the two observational epochs extracted using a 30 mas aperture towards the stellar continuum. The thick line corresponds to the radiative transfer model from Khouri et al. (2014). The vertical lines indicate the stellar velocity and expansion velocity as in Fig. 2. The absorption profile (black dotted line) due to atmospheric CO was added to the model during ray-tracing. Right: radiative transfer models of the CO J = 3−2 emissionaround W Hya including an enhanced IR radiation field with values of M = 2 and M = 3, compared to the baseline model with no IR enhancement from Khouri et al. (2014) (equivalent to M = 1) and a representative model that reproduces the observations (see text). The emission was taken from an aperture of 30 mas. Because the radiative transfer model does not include the increased continuum opacity of the extended stellar atmosphere at submillimetre and radio wavelengths (e.g. Vlemmings et al. 2019), weak slightly red-shifted emission from behind the star is also seen in the model.
Current usage metrics show cumulative count of Article Views (full-text article views including HTML views, PDF and ePub downloads, according to the available data) and Abstracts Views on Vision4Press platform.
Data correspond to usage on the plateform after 2015. The current usage metrics is available 48-96 hours after online publication and is updated daily on week days.
Initial download of the metrics may take a while.