Fig. 1
Download original image
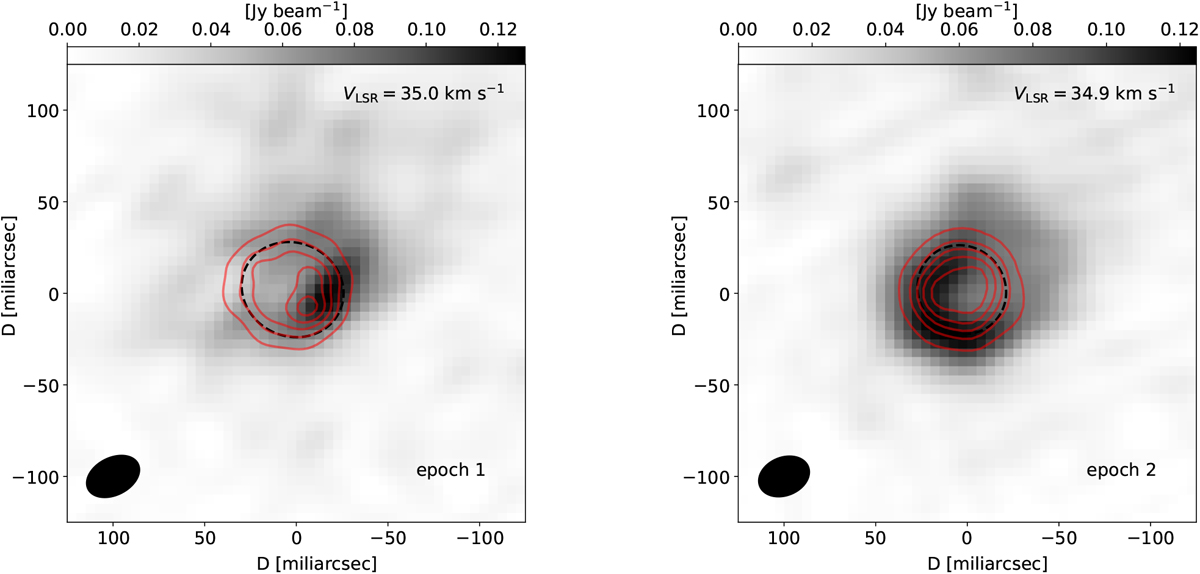
Maps representing the channel with the brightest CO J = 3−2 emission around W Hya for the two observational epochs (30 Nov.–5 Dec. 2015 and 25 Nov. 2017). The strongest emission against the stellar continuum represents CO maser amplification. The grey scale is the continuum subtracted CO emission for a single channel ~ 1 km s−1 in width. The synthesised beam is indicated in the bottom left corner and the channel velocity is indicated in the top right corner. The red solid contours indicate the uniformly imaged stellar continuum at 10, 30, 50, 70, and 90% of the peak emission. The black dashed ellipses are the fitted stellar disc, as determined in Vlemmings et al. (2017, 2019).
Current usage metrics show cumulative count of Article Views (full-text article views including HTML views, PDF and ePub downloads, according to the available data) and Abstracts Views on Vision4Press platform.
Data correspond to usage on the plateform after 2015. The current usage metrics is available 48-96 hours after online publication and is updated daily on week days.
Initial download of the metrics may take a while.