Fig. 8.
Download original image
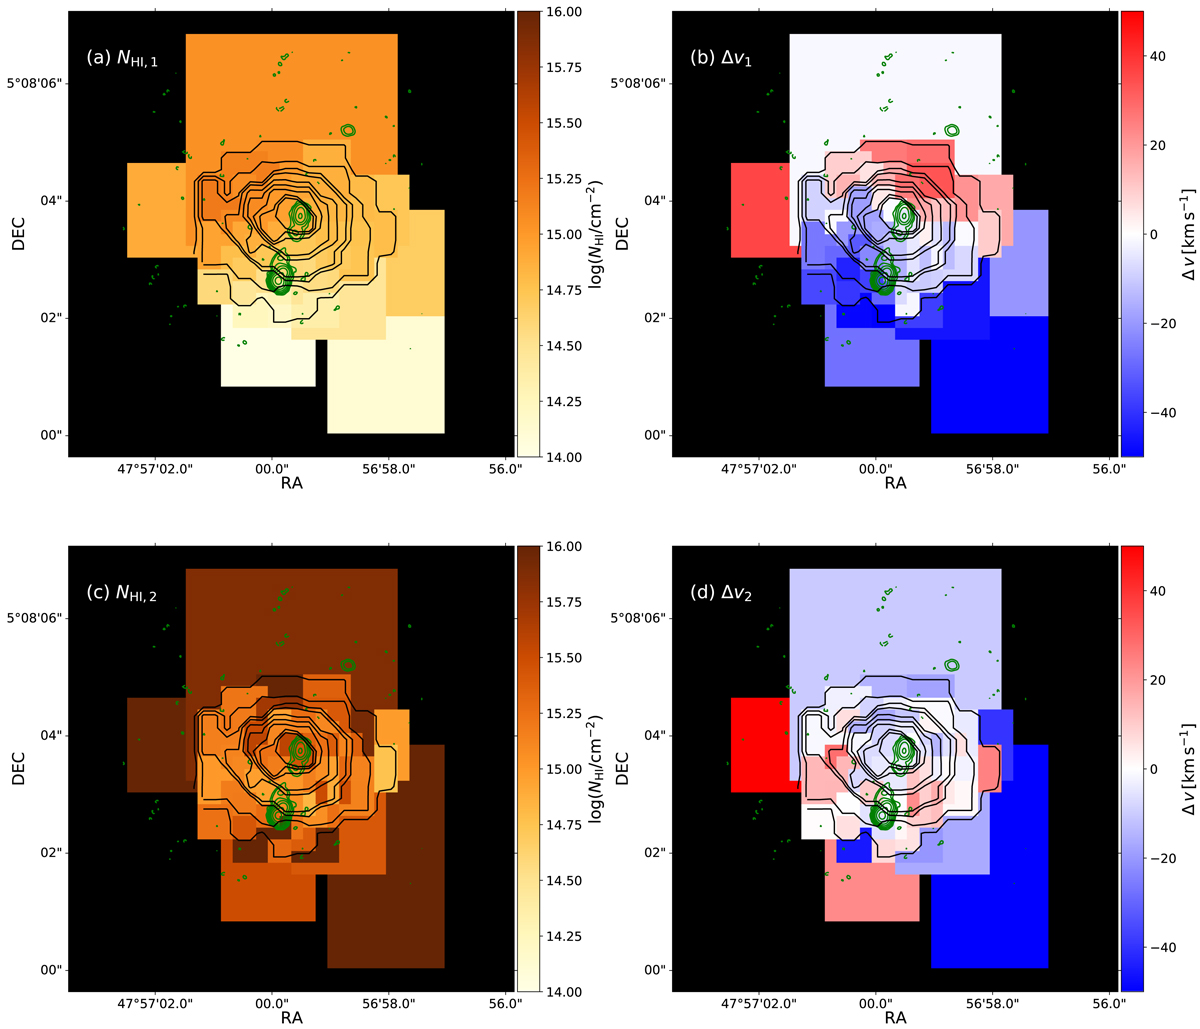
Column density and velocity shift maps of H I absorber #1 (panels a and b) and #2 (panels c and d). The black contours are the same as in Fig. 7. The zero points for the velocity shift maps are chosen individually to be the Δv of each absorber as derived from the master spectrum fitting reported in Table 2. The maps therefore show the velocity shifts relative to the redshift of the respective absorber.
Current usage metrics show cumulative count of Article Views (full-text article views including HTML views, PDF and ePub downloads, according to the available data) and Abstracts Views on Vision4Press platform.
Data correspond to usage on the plateform after 2015. The current usage metrics is available 48-96 hours after online publication and is updated daily on week days.
Initial download of the metrics may take a while.