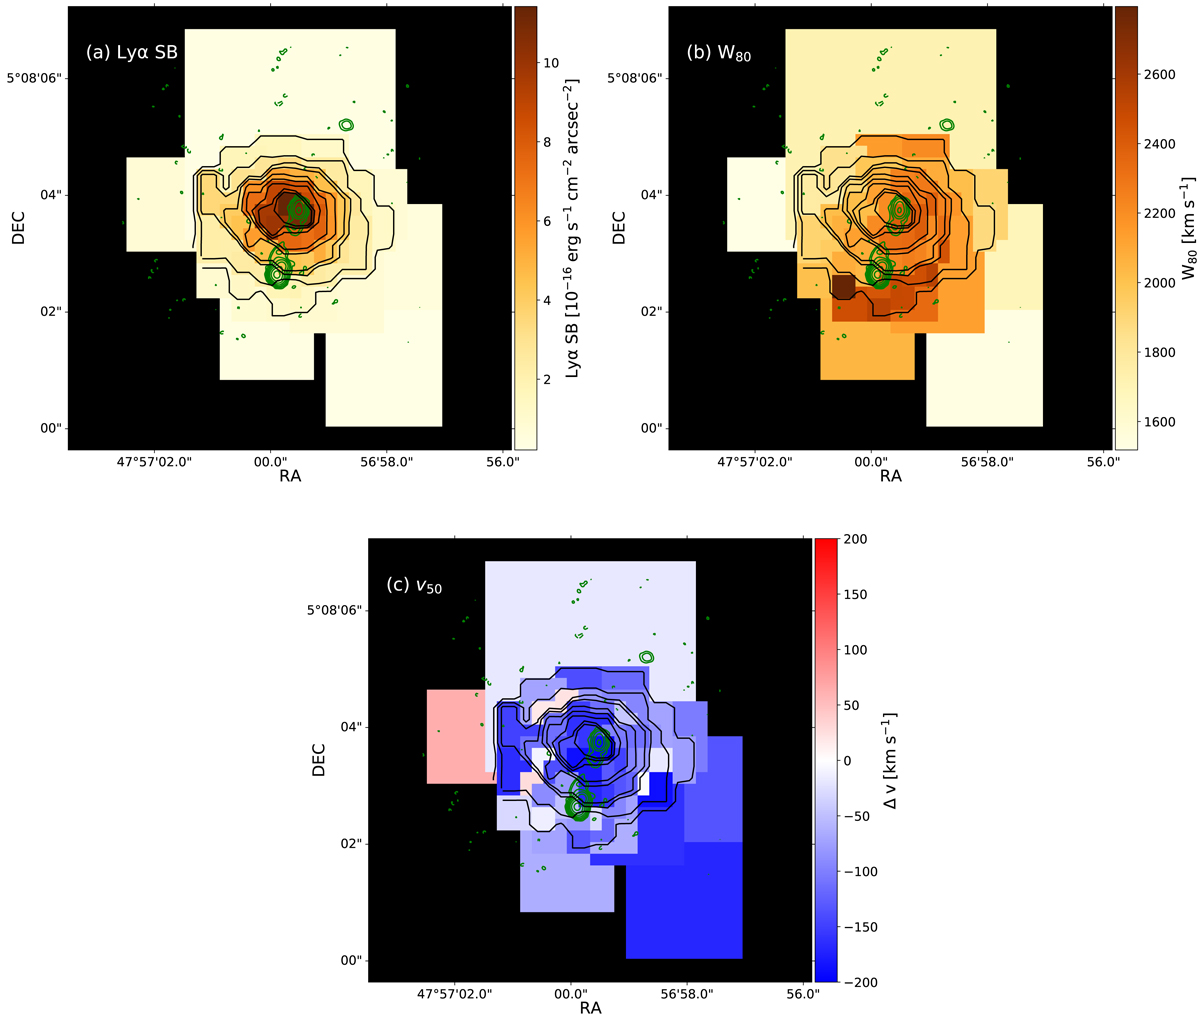
Fig. 7.
Download original image
Spatial mapping results of Lyα emission. The contours are the same in all panels, with the green showing the position of the radio source (see the Fig. 1 caption for details; Parijskij et al. 2013, 2014) and black tracing the Lyα surface brightness resulting from spatial fitting (the levels are given arbitrarily). All these maps are constructed based on the fitting results, i.e., not directly from the data. (a) Intrinsic surface brightness map of Lyα emission. (b) W80 map of Lyα emission (nonparametric measurement of the line width; see text). (c) v50 map of the fitted Lyα emission profile (nonparametric measurement of the line-of-sight velocity; see text).
Current usage metrics show cumulative count of Article Views (full-text article views including HTML views, PDF and ePub downloads, according to the available data) and Abstracts Views on Vision4Press platform.
Data correspond to usage on the plateform after 2015. The current usage metrics is available 48-96 hours after online publication and is updated daily on week days.
Initial download of the metrics may take a while.