Fig. 6.
Download original image
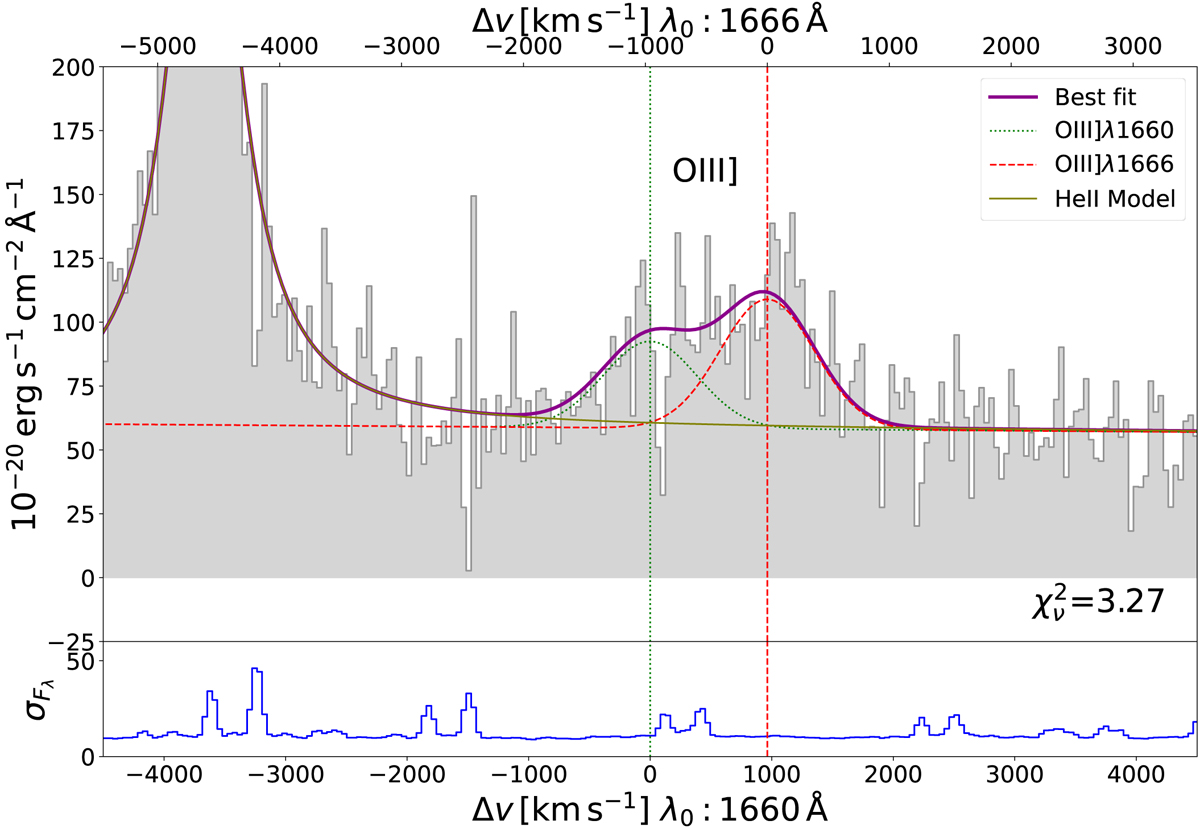
O III] best-fit model using the MCMC method. The dark magenta line shows the best O III] fit combined with the He II from Sect. 4.2. The emissions of the O III] doublet are shown in dotted green and dashed red curves. The line centers of the systemic emissions expected for the doublet components from the He II implied redshift are shown in vertical dotted green and red lines. The solid olive line shows the He II model that is fixed in the O III] fit. The ![]() of the fit is reported to give a hint of the quality of the fit. Lower panel: standard deviation (noise) of the spectrum derived from the variance extension of the data cube that is used as a fitting weight. It is shown in the same units as the spectrum and can be used to trace the skylines.
of the fit is reported to give a hint of the quality of the fit. Lower panel: standard deviation (noise) of the spectrum derived from the variance extension of the data cube that is used as a fitting weight. It is shown in the same units as the spectrum and can be used to trace the skylines.
Current usage metrics show cumulative count of Article Views (full-text article views including HTML views, PDF and ePub downloads, according to the available data) and Abstracts Views on Vision4Press platform.
Data correspond to usage on the plateform after 2015. The current usage metrics is available 48-96 hours after online publication and is updated daily on week days.
Initial download of the metrics may take a while.