Fig. 5.
Download original image
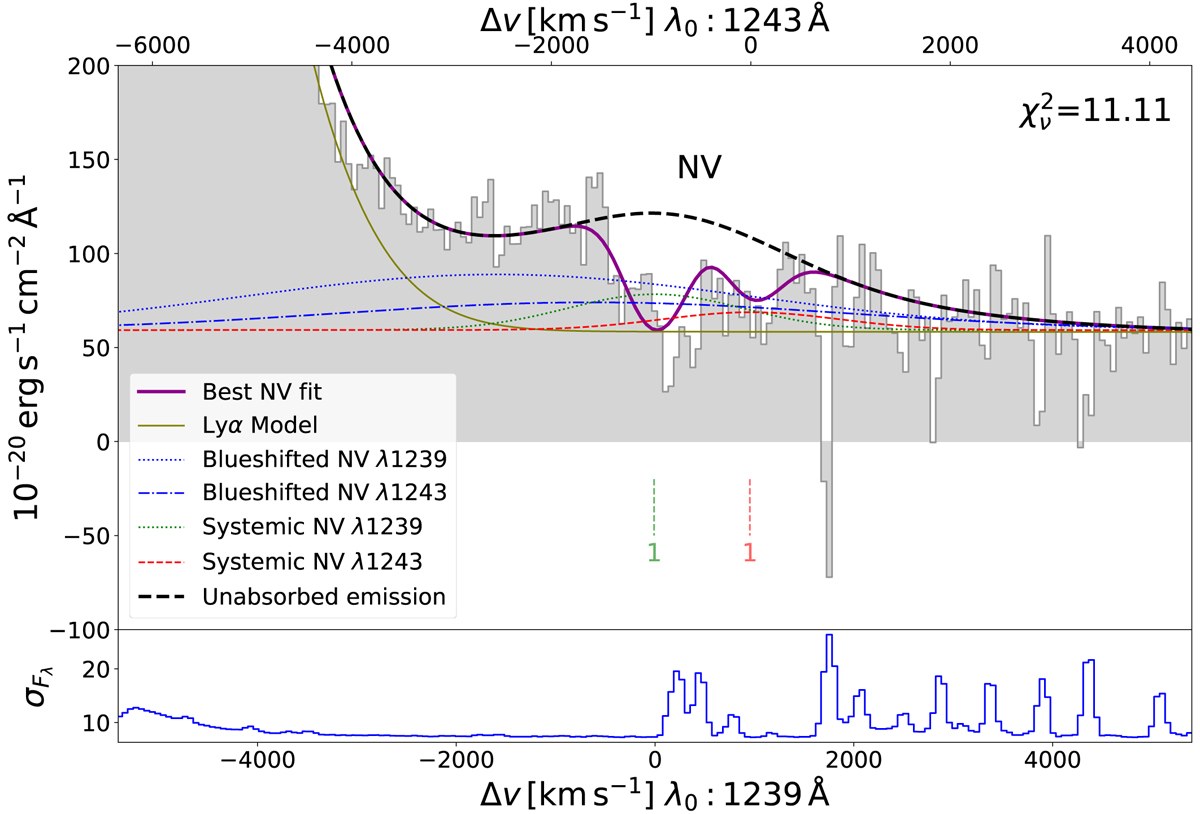
N V best-fit model from MCMC method. The dark magenta line shows the best N V fit combined with the Lyα from Sect. 4.1. The black dashed line marks all combined emissions without absorption. The systemic emissions are marked in dotted green, and dashed red curves show the doublet. The zero velocities of the systemic emissions for the doublet components are derived from the He II result. The blueshifted components are shown in dotted and dot-dash blue lines for the doublet. The solid olive line shows the Lyα model, which is fixed in the N V fit. The short green (red) vertical bars with numbers show the positions of the absorbers on top of the N Vλ1239 (N Vλ1243) line. The dashed line style and lighter color are used to indicate that N V absorber #1 is marginally constrained (see text). The ![]() of the fit is reported to give a hint of the quality of the fit. Lower panel: standard deviation (noise) of the spectrum derived from the variance extension of the data cube that is used as the fitting weight. It is shown in the same units as the spectrum and can be used to trace the skylines.
of the fit is reported to give a hint of the quality of the fit. Lower panel: standard deviation (noise) of the spectrum derived from the variance extension of the data cube that is used as the fitting weight. It is shown in the same units as the spectrum and can be used to trace the skylines.
Current usage metrics show cumulative count of Article Views (full-text article views including HTML views, PDF and ePub downloads, according to the available data) and Abstracts Views on Vision4Press platform.
Data correspond to usage on the plateform after 2015. The current usage metrics is available 48-96 hours after online publication and is updated daily on week days.
Initial download of the metrics may take a while.