Fig. 4.
Download original image
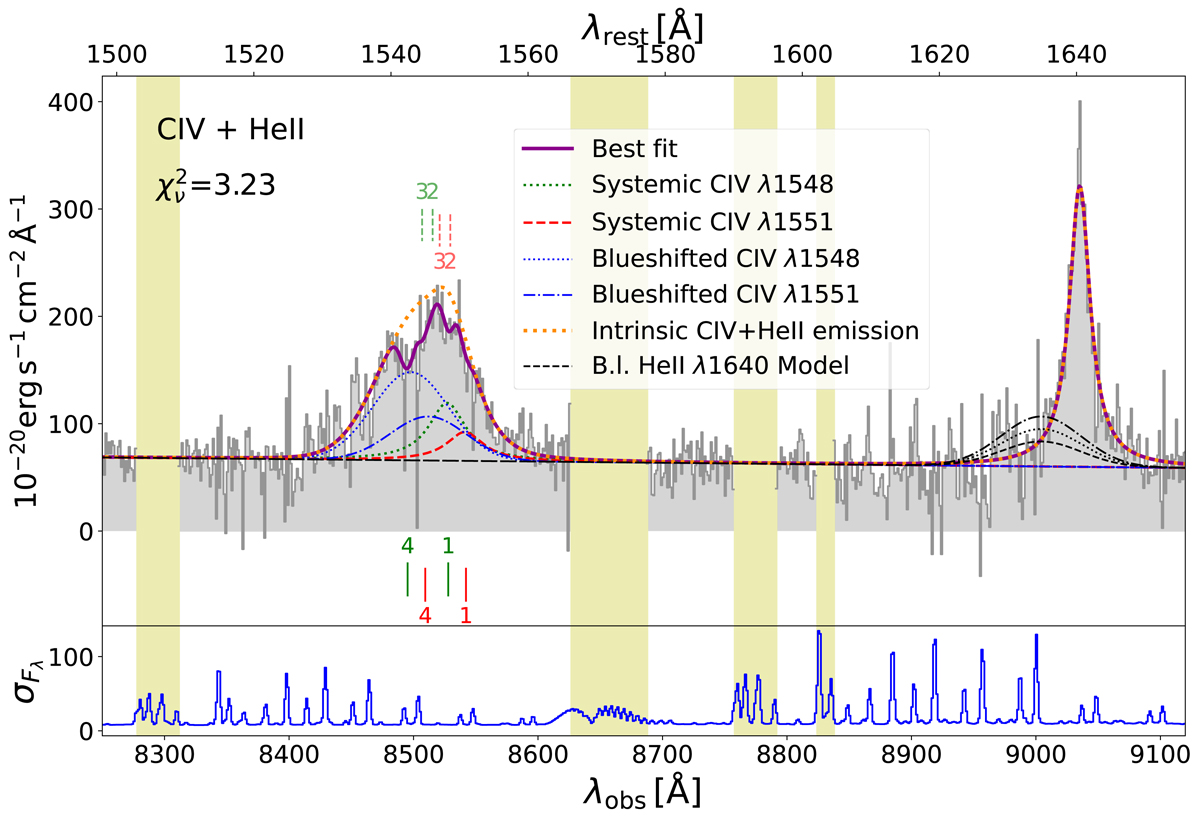
Best fit of the C IV and He II lines from the master spectrum using the MCMC method. We use the dark magenta line to trace the best fit of these two lines. For the intrinsic C IV and He II, the yellow dotted line is used. We mark the systemic emissions of the C IV doublet in dotted green and dashed red lines and blueshifted emissions in dotted and dot-dash blue lines. The ![]() of the fit is reported to give a hint of the quality of the fit. The yellow shaded regions are excluded during the fit because it is severely affected by skylines (compared with the Hanuschik 2003 data; see also the standard deviation in the lower panel, which offers an alternative proof of the positions of the skylines). The short green (red) vertical bars with numbers show the positions of the absorbers on top of the C IVλ1548 (C IVλ1551) line. Absorbers #2 and #3 are marginally constrained (see text), and hence their positions are shown in dashed bars with lighter numbers. The black lines are models of blueshifted He II lines with FWHM and velocity shift fixed to the fitted values from the C IV blueshifted component. The dashed, dotted, and dash-dotted lines show the line flux of 0.2, 0.3, and 0.4 of the total fitted flux of the blueshifted C IV. Lower panel: standard deviation (noise) of the spectrum derived from the variance extension of the data cube, which is used as a fitting weight. It is shown in the same units as the spectrum and can be used to trace the skylines.
of the fit is reported to give a hint of the quality of the fit. The yellow shaded regions are excluded during the fit because it is severely affected by skylines (compared with the Hanuschik 2003 data; see also the standard deviation in the lower panel, which offers an alternative proof of the positions of the skylines). The short green (red) vertical bars with numbers show the positions of the absorbers on top of the C IVλ1548 (C IVλ1551) line. Absorbers #2 and #3 are marginally constrained (see text), and hence their positions are shown in dashed bars with lighter numbers. The black lines are models of blueshifted He II lines with FWHM and velocity shift fixed to the fitted values from the C IV blueshifted component. The dashed, dotted, and dash-dotted lines show the line flux of 0.2, 0.3, and 0.4 of the total fitted flux of the blueshifted C IV. Lower panel: standard deviation (noise) of the spectrum derived from the variance extension of the data cube, which is used as a fitting weight. It is shown in the same units as the spectrum and can be used to trace the skylines.
Current usage metrics show cumulative count of Article Views (full-text article views including HTML views, PDF and ePub downloads, according to the available data) and Abstracts Views on Vision4Press platform.
Data correspond to usage on the plateform after 2015. The current usage metrics is available 48-96 hours after online publication and is updated daily on week days.
Initial download of the metrics may take a while.