Fig. 3.
Download original image
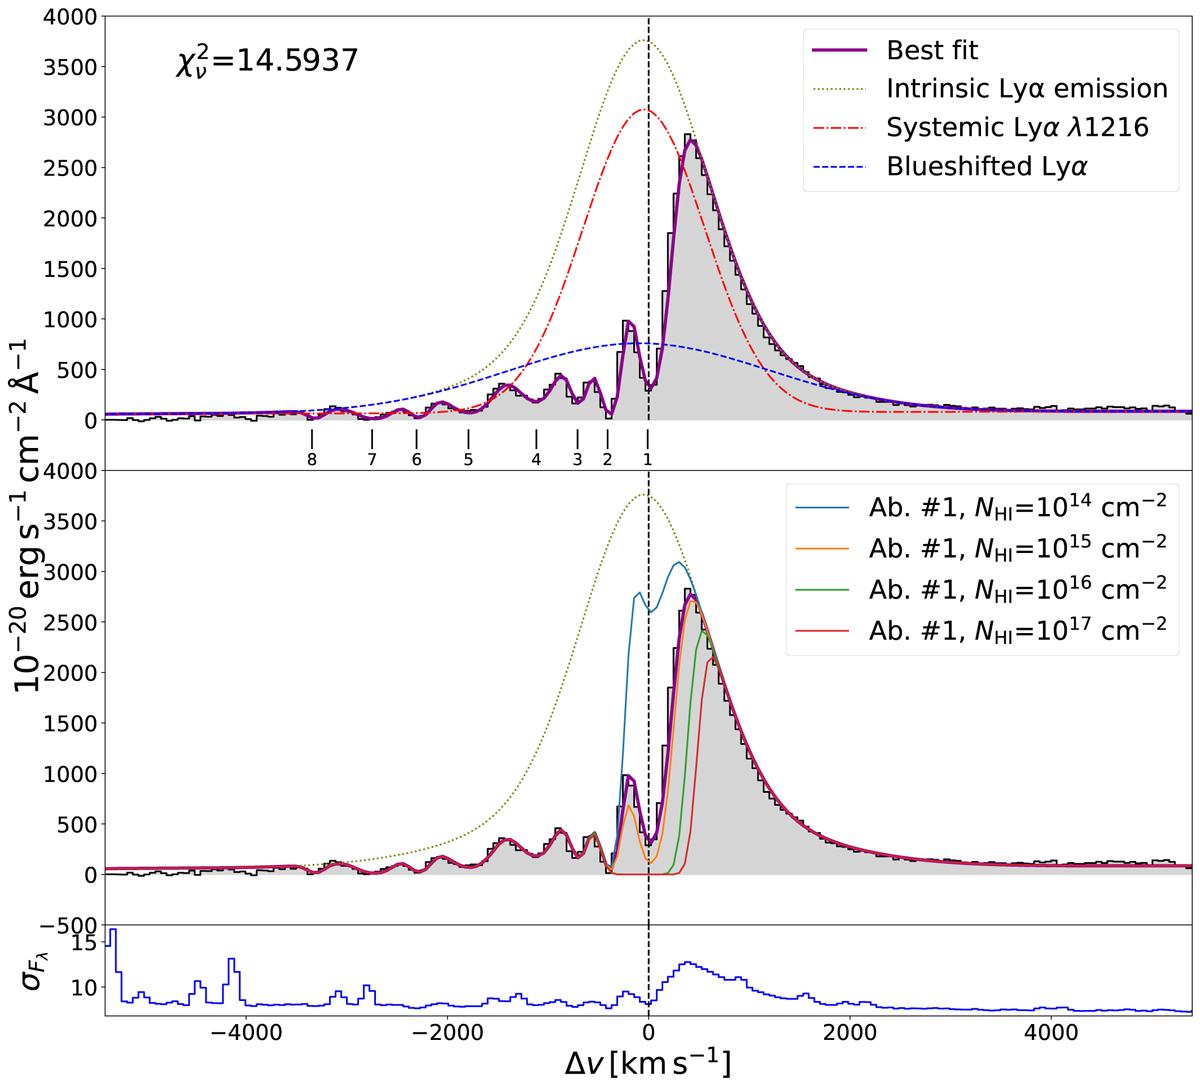
Lyα fitting result and model sensitivity check. Upper panel: best fitting result of the master Lyα line using the MCMC method. The dark magenta line represents the best fit, while the dotted olive line traces the overall Gaussian emission. The systemic emission is shown in a red dotted-dashed line, and the blueshifted emission is marked by a blue dashed line. The positions of all eight absorbers are shown in this panel with black vertical bars. The ![]() is reported as an indicator for the quality of the fit. We note that the small flux excess at ≳4000 km s−1 is the contribution from N V (Sect. 4.3). Middle panel: column density sensitivity check of the Voigt model. The overall intrinsic Gaussian (dotted olive line) and best-fit model (dark magenta line) are the same as in the upper panel. The other lines show how the fitting result will change by only adjusting the column density of absorber #1 to values at log(NH I/cm−2) = 14, 15, 16, and 17. These lines demonstrate that this fitting is only sensitive to the NH values around the best fitting result. Lower panel: standard deviation (noise) of the spectrum derived from the variance extension of the data cube that is used as the weight (inverse) in the fitting. It is shown in the same units as the spectrum and can be used to trace the skylines. We note that the Lyα line suffers less from strong skylines in −4200 to 5500 km s−1 compared to Hanuschik (2003).
is reported as an indicator for the quality of the fit. We note that the small flux excess at ≳4000 km s−1 is the contribution from N V (Sect. 4.3). Middle panel: column density sensitivity check of the Voigt model. The overall intrinsic Gaussian (dotted olive line) and best-fit model (dark magenta line) are the same as in the upper panel. The other lines show how the fitting result will change by only adjusting the column density of absorber #1 to values at log(NH I/cm−2) = 14, 15, 16, and 17. These lines demonstrate that this fitting is only sensitive to the NH values around the best fitting result. Lower panel: standard deviation (noise) of the spectrum derived from the variance extension of the data cube that is used as the weight (inverse) in the fitting. It is shown in the same units as the spectrum and can be used to trace the skylines. We note that the Lyα line suffers less from strong skylines in −4200 to 5500 km s−1 compared to Hanuschik (2003).
Current usage metrics show cumulative count of Article Views (full-text article views including HTML views, PDF and ePub downloads, according to the available data) and Abstracts Views on Vision4Press platform.
Data correspond to usage on the plateform after 2015. The current usage metrics is available 48-96 hours after online publication and is updated daily on week days.
Initial download of the metrics may take a while.