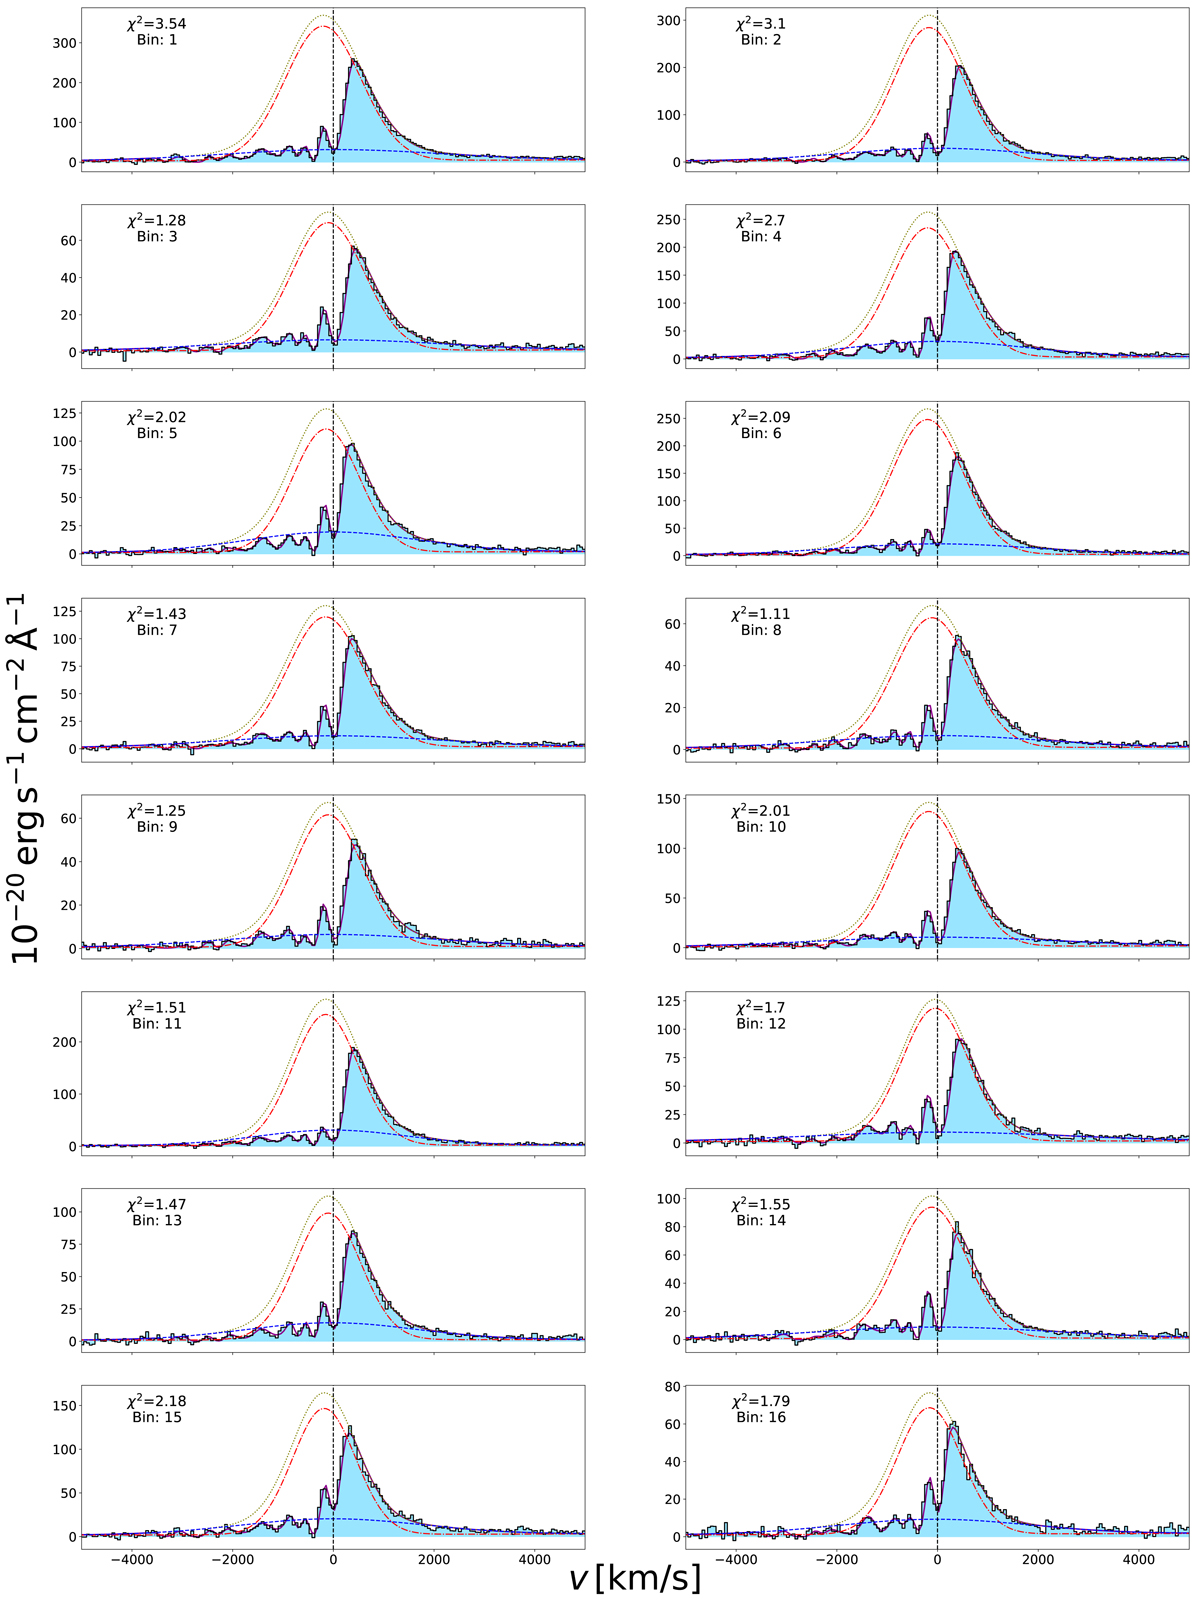
Fig. F.2.
Download original image
Spectra extracted from the 64 spatial bins (see Sect. 3.3) and Gaussian+Voigt fitting results. In each panel, the thick dark magenta line indicates the best fit model. The dot-dash red line and dashed blue line denote the narrow and broad emission components, respectively. The dotted olive lines are the summation of the two emissions. The ![]() calculated from each fit is shown as an indicator of the fit quality. We note that each spectrum is summed from the spatial bin, each of which contains a different number of spaxels. Hence, the fluxes of the spectra shown here are not to be compared directly.
calculated from each fit is shown as an indicator of the fit quality. We note that each spectrum is summed from the spatial bin, each of which contains a different number of spaxels. Hence, the fluxes of the spectra shown here are not to be compared directly.
Current usage metrics show cumulative count of Article Views (full-text article views including HTML views, PDF and ePub downloads, according to the available data) and Abstracts Views on Vision4Press platform.
Data correspond to usage on the plateform after 2015. The current usage metrics is available 48-96 hours after online publication and is updated daily on week days.
Initial download of the metrics may take a while.