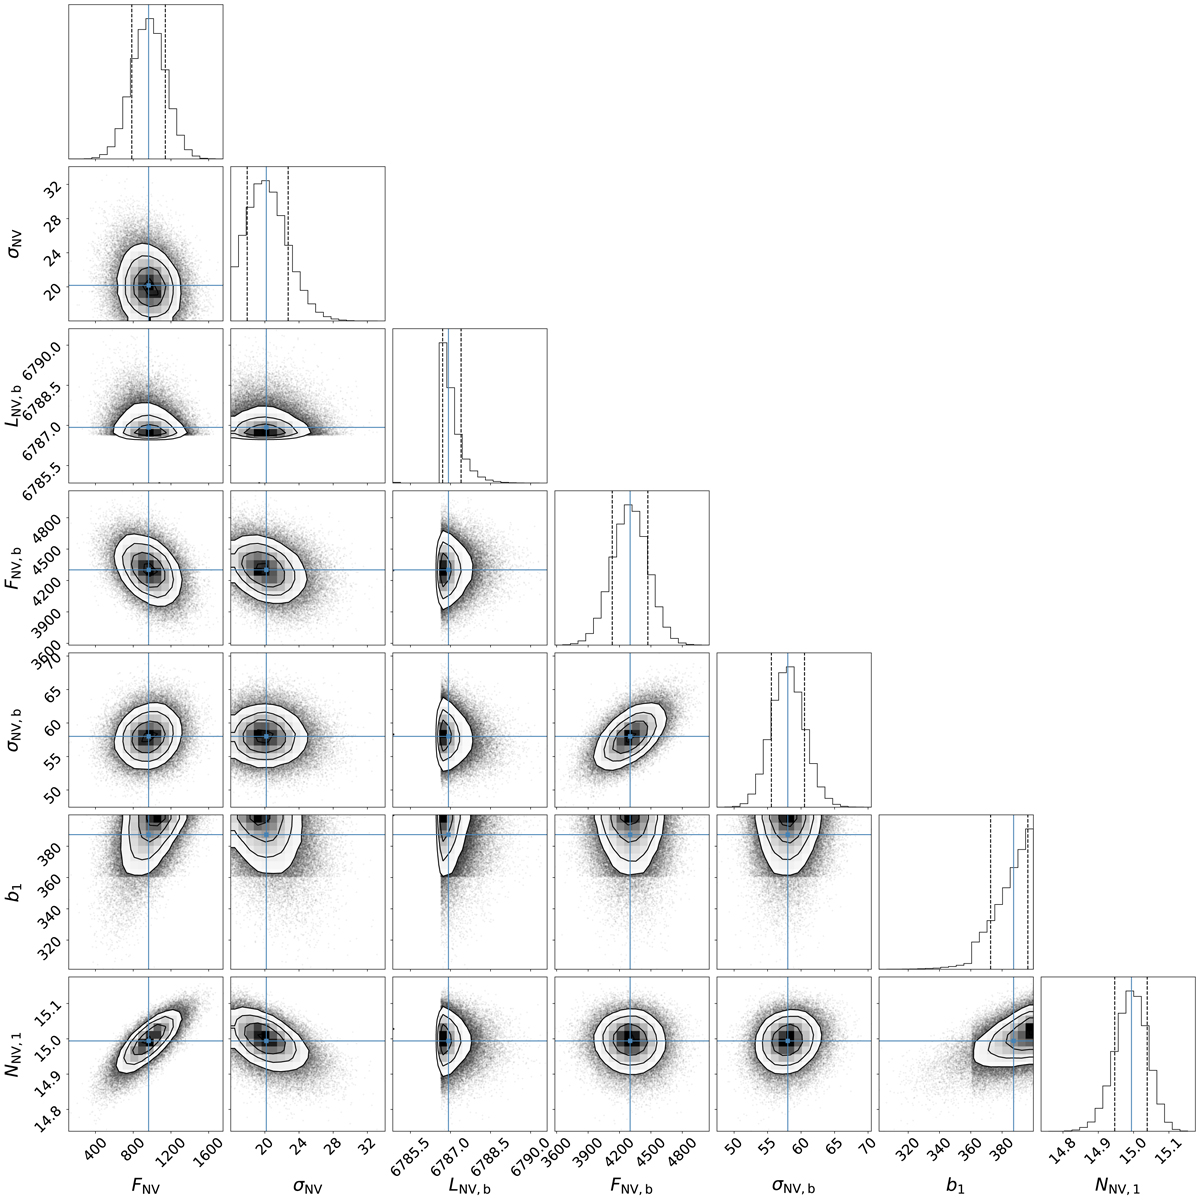
Fig. E.6.
Download original image
Corner plot derived from the MCMC fitting of the N V (Sect. 4.2). In this figure we show the integrated line flux (FN V in 10−20 erg s−1 cm−2 Å−1) and the Gaussian line width (σN V, in Å) of the systemic N V emission; the line center (LN V,b in Å), integrated line flux (FN V,b), and Gaussian line width (σN V,b) of the blueshifted N V component (for the 1238 Å line); and the Doppler parameter (b1) and column density (NN V,1) of absorber #1. The black dotted lines in each of the histograms represent 15.8 and 84.2 percentiles, which correspond to the reported uncertainty ranges. The blue solid lines mark the median and reported fit values, respectively.
Current usage metrics show cumulative count of Article Views (full-text article views including HTML views, PDF and ePub downloads, according to the available data) and Abstracts Views on Vision4Press platform.
Data correspond to usage on the plateform after 2015. The current usage metrics is available 48-96 hours after online publication and is updated daily on week days.
Initial download of the metrics may take a while.