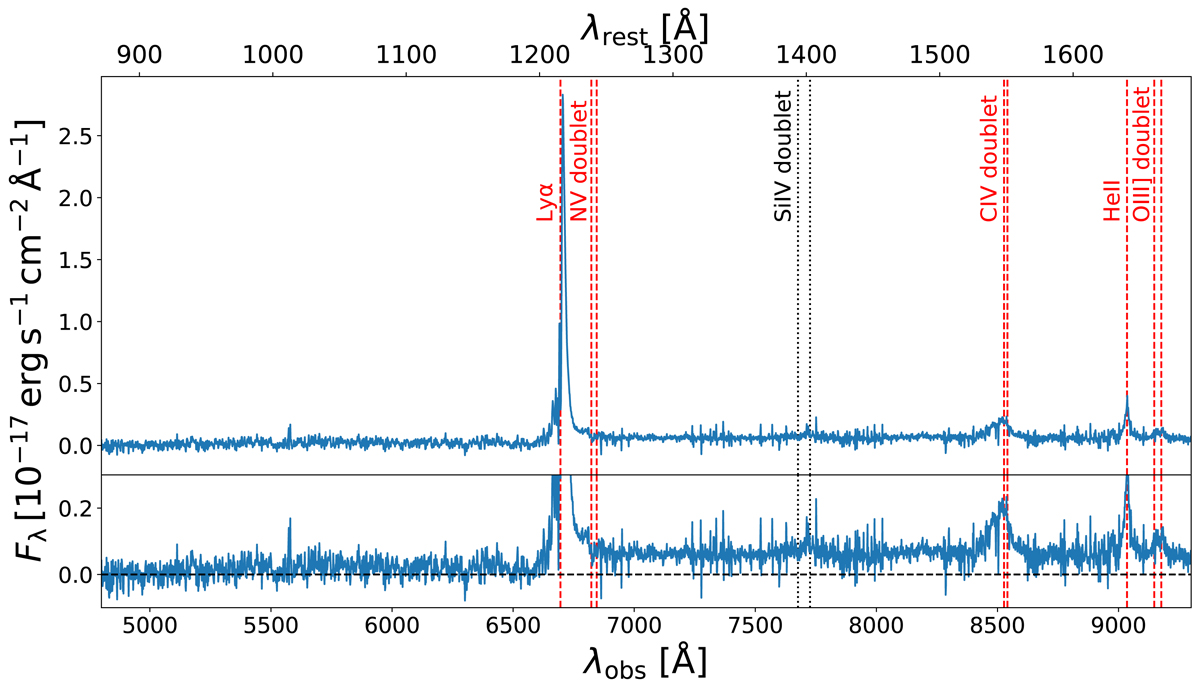
Fig. 2.
Download original image
Rest frame UV spectra of 4C04.11. Upper panel: full MUSE spectrum extracted from the central 1 arcsec aperture region. We refer to this spectrum as the master spectrum. The detected UV lines (Lyα, C IV, He II, and O III]) are marked with red dashed lines. We also mark the N V, which has a low S/N, overlaps with the broad Lyα wing, and is not obvious in this full spectrum (see Sect. 4.3). We use the black dotted line to indicate the position of the undetected Si IV. Lower panel: same plot as the upper panel but zoomed in to show the continuum. We note that the skyline residuals are seen as regions with higher noise. The horizontal black dashed line marks the zero flux level.
Current usage metrics show cumulative count of Article Views (full-text article views including HTML views, PDF and ePub downloads, according to the available data) and Abstracts Views on Vision4Press platform.
Data correspond to usage on the plateform after 2015. The current usage metrics is available 48-96 hours after online publication and is updated daily on week days.
Initial download of the metrics may take a while.