Fig. B.1.
Download original image
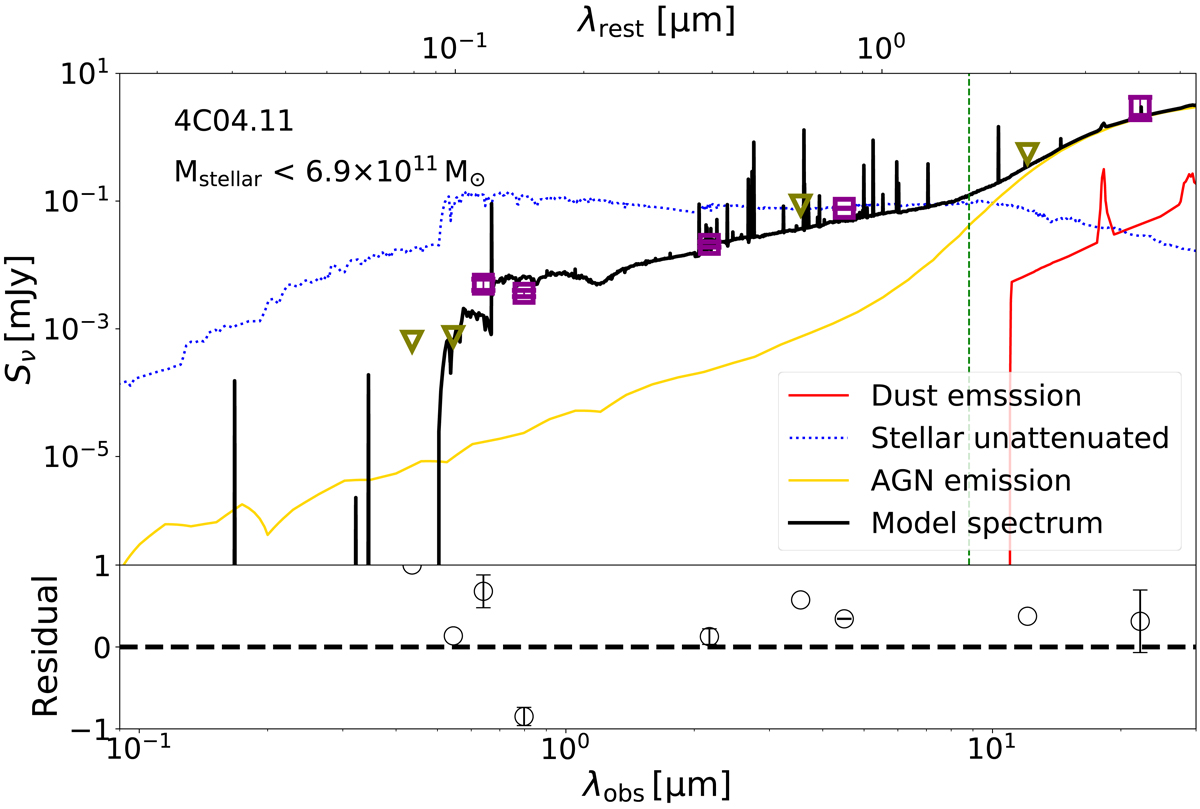
SED fitting model and photometric data. In the upper panel, we show the fitted SED model spectrum from X-CIGALE with a black curve. In addition, dust and unattenuated stellar and AGN emissions are shown in red, blue dotted, and yellow curves, respectively. The input observed photometry flux densities are marked in dark magenta boxes and olive triangles (upper limits). The X-ray data are not shown as they do not constrain the stellar component. The green vertical dashed line is the position of rest frame 1.6 μm from which the unattenuated stellar flux is adopted for Mstellar estimation. In the lower panel, we present the relative residuals, ![]() , where Sν,obs and Sν,mod are the observed and model flux densities, respectively.
, where Sν,obs and Sν,mod are the observed and model flux densities, respectively.
Current usage metrics show cumulative count of Article Views (full-text article views including HTML views, PDF and ePub downloads, according to the available data) and Abstracts Views on Vision4Press platform.
Data correspond to usage on the plateform after 2015. The current usage metrics is available 48-96 hours after online publication and is updated daily on week days.
Initial download of the metrics may take a while.