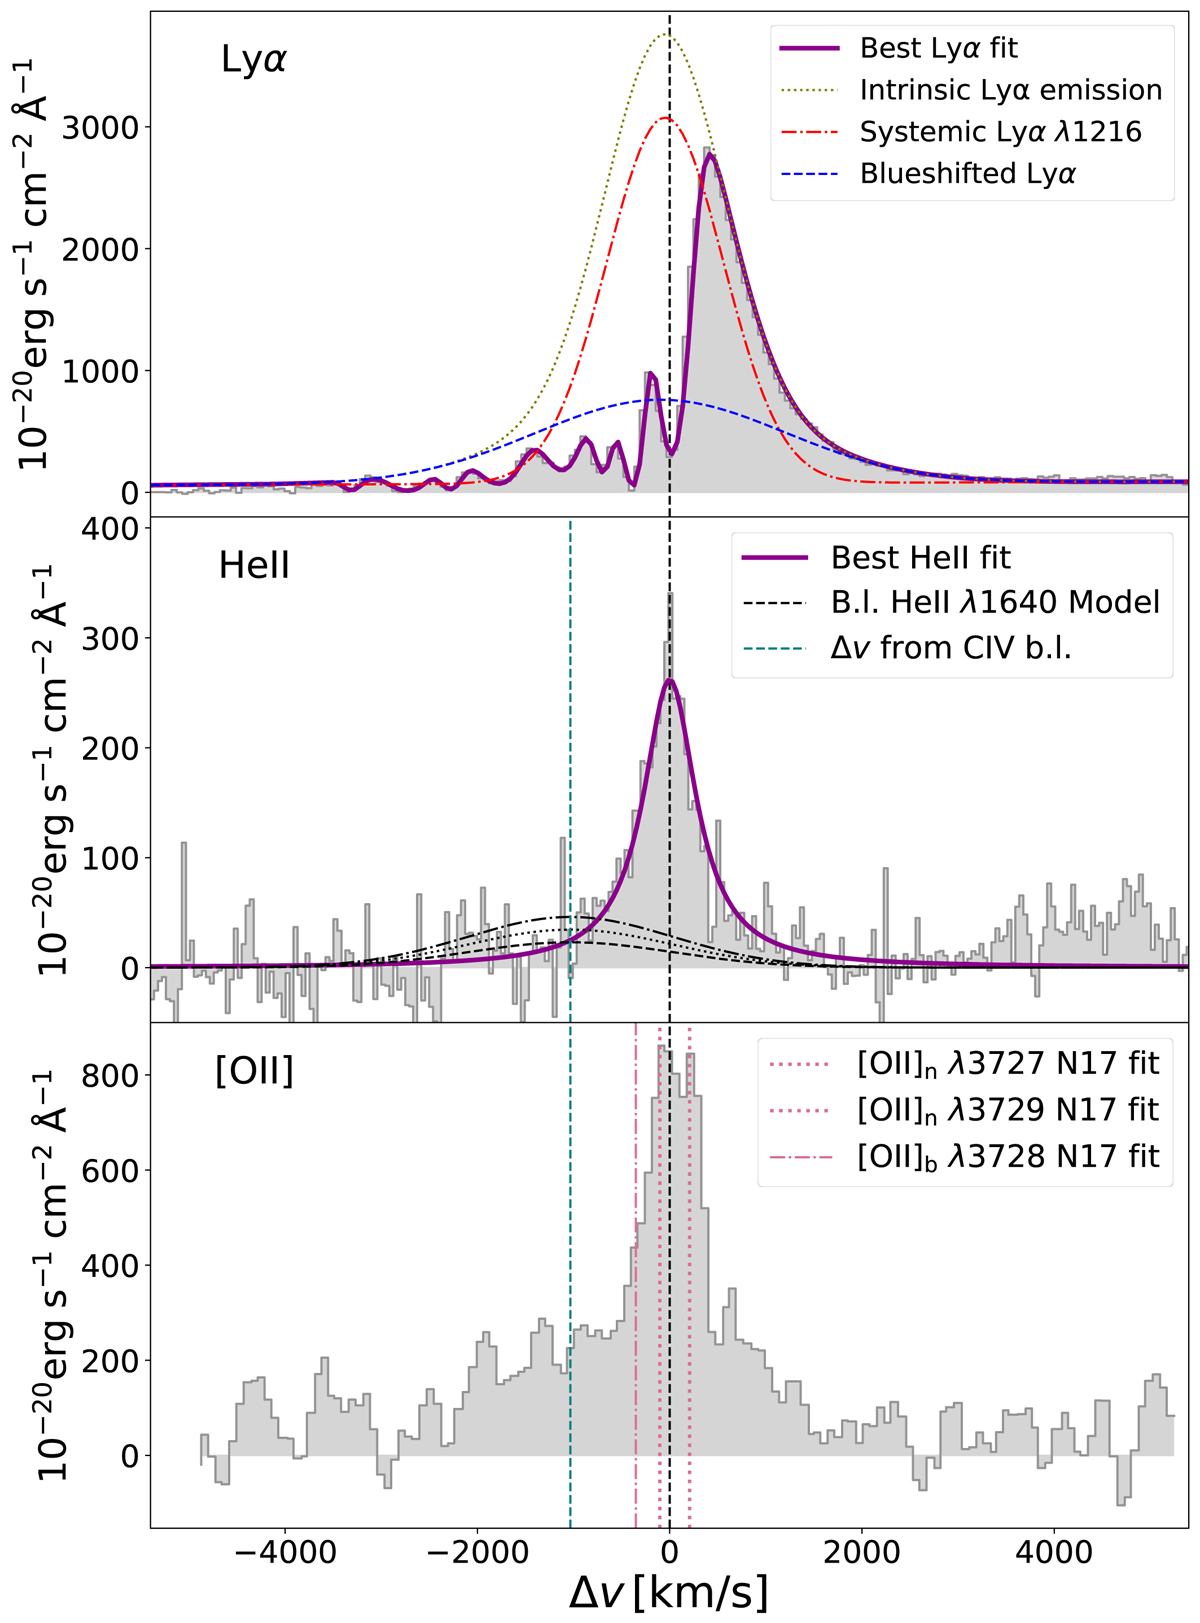
Fig. 11.
Download original image
Comparison between the Lyα, He II, and [O II] rest-frame spectra. The Lyα and He II presented here are the same ones analyzed in Sects. 4.1 and 4.2 in velocity scale. We subtract the continuum from the He II here to better present the low flux region of the emission. The black lines are the same ones as shown in Fig. 4 for the blueshifted He II models, with the dashed, dotted, and dash-dotted lines indicating the line flux of 0.2, 0.3, and 0.4 of the total fitted flux of the blueshifted C IV. The [O II] is taken from SINFONI (Nesvadba et al. 2017a). In each panel, the black dashed lines indicate the zero velocity. In the last two panels, the dashed vertical teal blue lines show the velocity shift of the C IV blueshifted component. For Lyα and He II, the best fit models from this work are shown. We also mark the fitted line centers of the [O II] narrow doublet from Nesvadba et al. (2017a) in pink dotted lines and the broad component line center in a pink dash-dot line.
Current usage metrics show cumulative count of Article Views (full-text article views including HTML views, PDF and ePub downloads, according to the available data) and Abstracts Views on Vision4Press platform.
Data correspond to usage on the plateform after 2015. The current usage metrics is available 48-96 hours after online publication and is updated daily on week days.
Initial download of the metrics may take a while.