Fig. 10.
Download original image
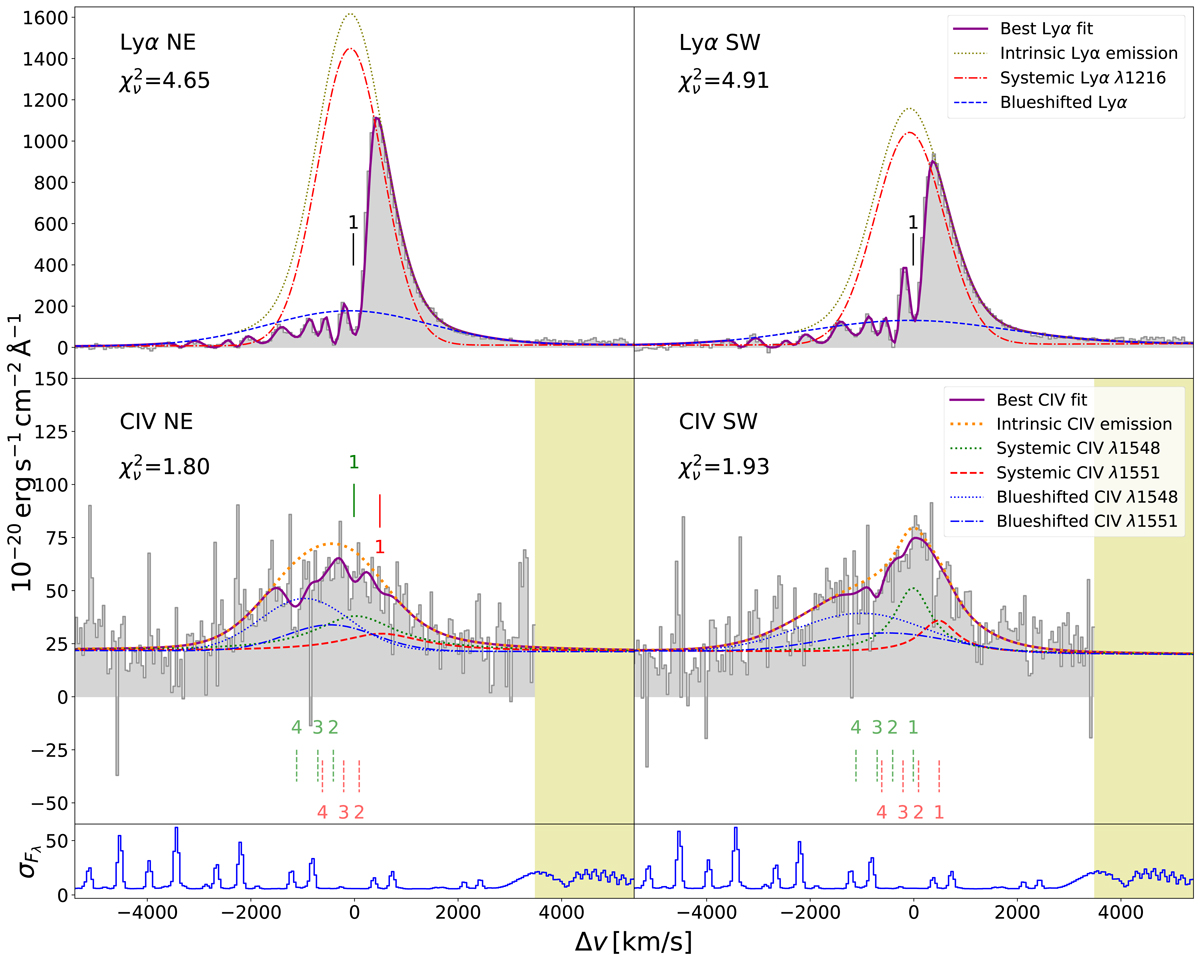
Spectra and fit of Lyα (top row) and C IV (middle row) and noise spectra of C IV (lower row) extracted from the dark blue (NE) and magenta (SW) regions shown in Fig. 9. The positions of H I absorber #1 are marked with black bars in the top row. The velocity shift is relative to the systemic redshift, z = 4.5077, fitted from He II (Sect. 4.2). The line styles used to show the fitting results are the same ones as that of the master Lyα (Fig. 3) and C IV (Fig. 4). We note that except for C IV absorber #1 detected in the NE region, the positions for the other C IV absorbers are marked in dashed bars, with lighter colors indicating that they are only marginally constrained (see text), which is consistent with the “master C IV” presentation (Fig. 4). The intrinsic C IV emission is also shown in orange dotted lines for the two spectra in the middle row. The panels in the bottom row show the standard deviations (noise) of the C IV spectra derived from the variance extension of the data cube, which are used as fitting weights. They are shown in the same units as the data spectra and can be used to show the quality of the spectra and trace the positions of skylines.
Current usage metrics show cumulative count of Article Views (full-text article views including HTML views, PDF and ePub downloads, according to the available data) and Abstracts Views on Vision4Press platform.
Data correspond to usage on the plateform after 2015. The current usage metrics is available 48-96 hours after online publication and is updated daily on week days.
Initial download of the metrics may take a while.