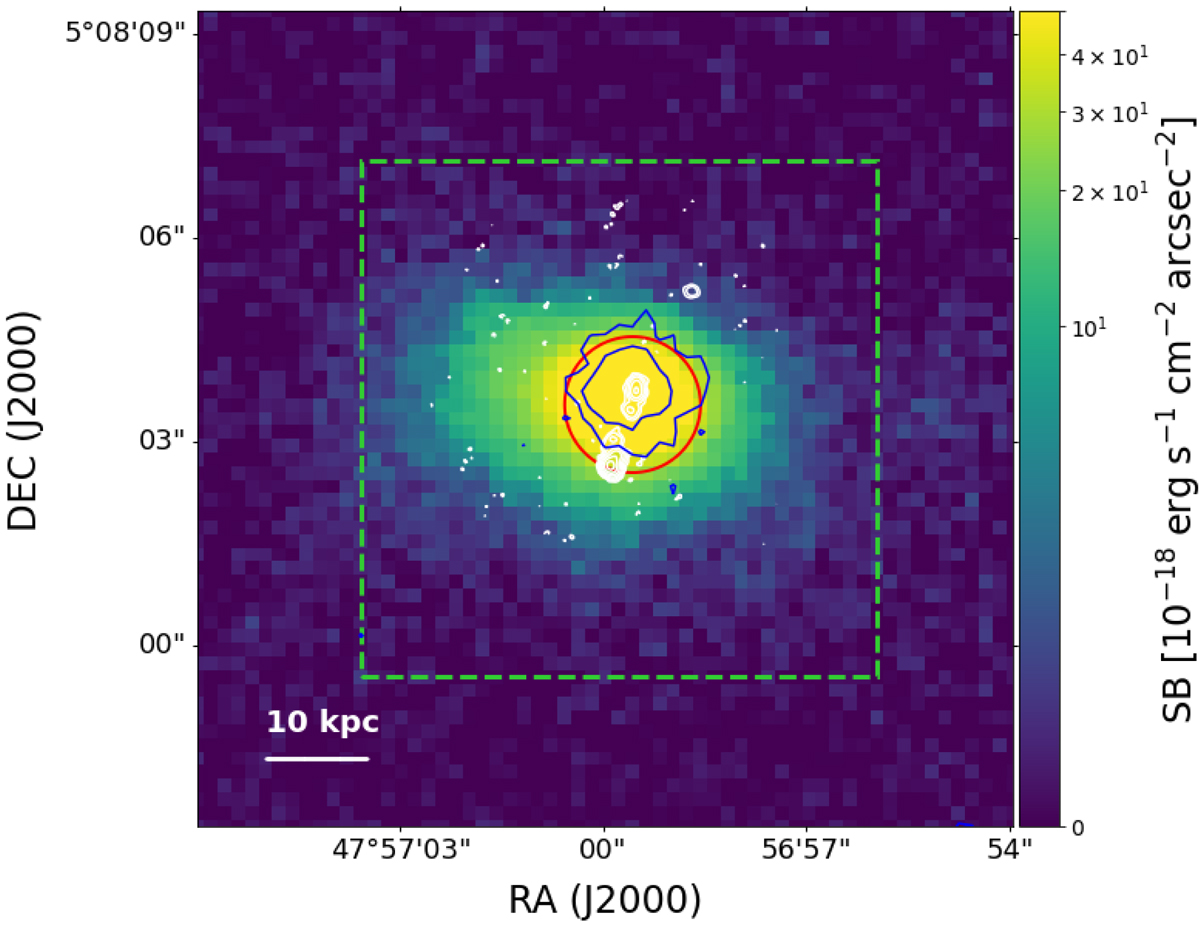
Fig. 1.
Download original image
Lyα narrowband surface brightness (SB) image of 4C04.11 derived from the data cube using 6704 − 6710 Å in the observed frame. The blue contour indicates the He II emission region. The contour is calculated from the pseudo-narrowband image of He II using 9028 − 9044 Å in the observed frame with the level of 3σHe II and 2 × 3σHe II, where σHe II is the standard deviation derived from a source-less region of the He II pseudo-narrowband image. The white contour traces the position of the radio jet observed by MERLIN (Multi-Element-Radio-Link-Interferometer-Network; Parijskij et al. 2013, 2014) with the level of 0.45 × (−1, 1, 2, 4, 16, 32, 48) mJy beam−1 following Parijskij et al. (2014). The overlaid red circle with a 1 arcsec radius marks the aperture over which the master spectrum is extracted. The green dashed box shows the FOV of individual panels in Figs. 7 and 8, which is the region we focus on in the spatial mapping in Sect. 5.
Current usage metrics show cumulative count of Article Views (full-text article views including HTML views, PDF and ePub downloads, according to the available data) and Abstracts Views on Vision4Press platform.
Data correspond to usage on the plateform after 2015. The current usage metrics is available 48-96 hours after online publication and is updated daily on week days.
Initial download of the metrics may take a while.