Fig. 3
Download original image
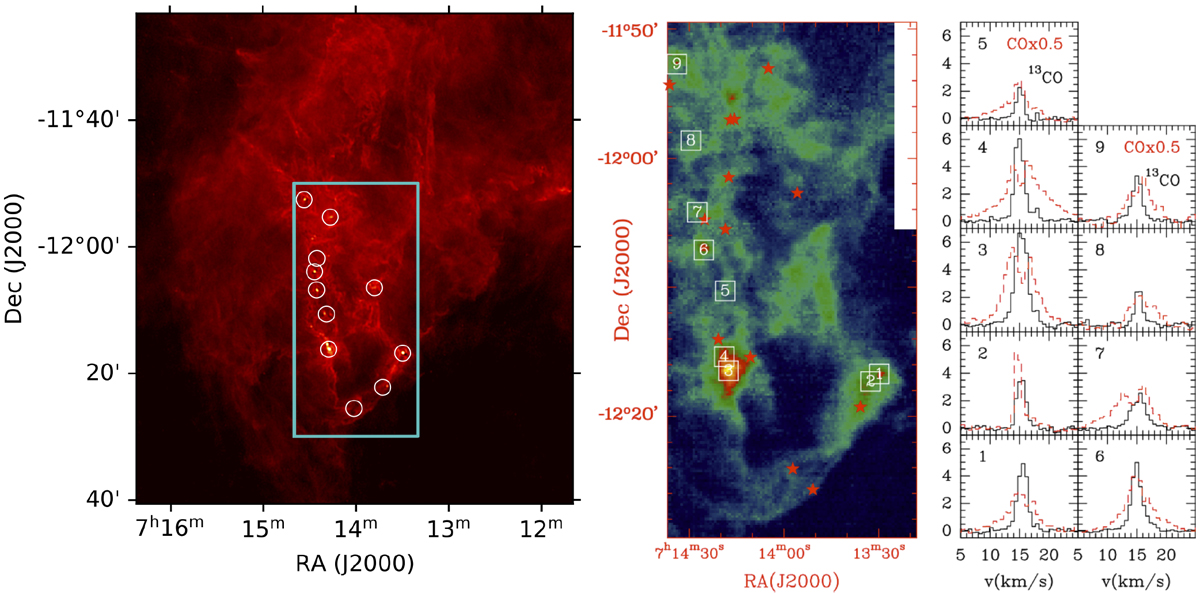
Dust and gas observations. Left: region covered by the IRAM observations (cyan box) overlaid on the Herschel SPIRE 250 μm map that illustrates the filamentary structure of the cloud and the distribution of bright IRAS sources (white circles). Middle: 13CO map revealing dense cores roughly related to the IRAS sources. The location of the WISE sources (Class I) are marked by red stars. The location of the nine dense cores listed in Table 1 is drawn with white squares. Right: core emission (TMB) observed in the 13CO (black) and 12CO (dashed red)J=1–0 transitions. A scaling factor of 0.5 has been applied to the 12CO line intensity.
Current usage metrics show cumulative count of Article Views (full-text article views including HTML views, PDF and ePub downloads, according to the available data) and Abstracts Views on Vision4Press platform.
Data correspond to usage on the plateform after 2015. The current usage metrics is available 48-96 hours after online publication and is updated daily on week days.
Initial download of the metrics may take a while.