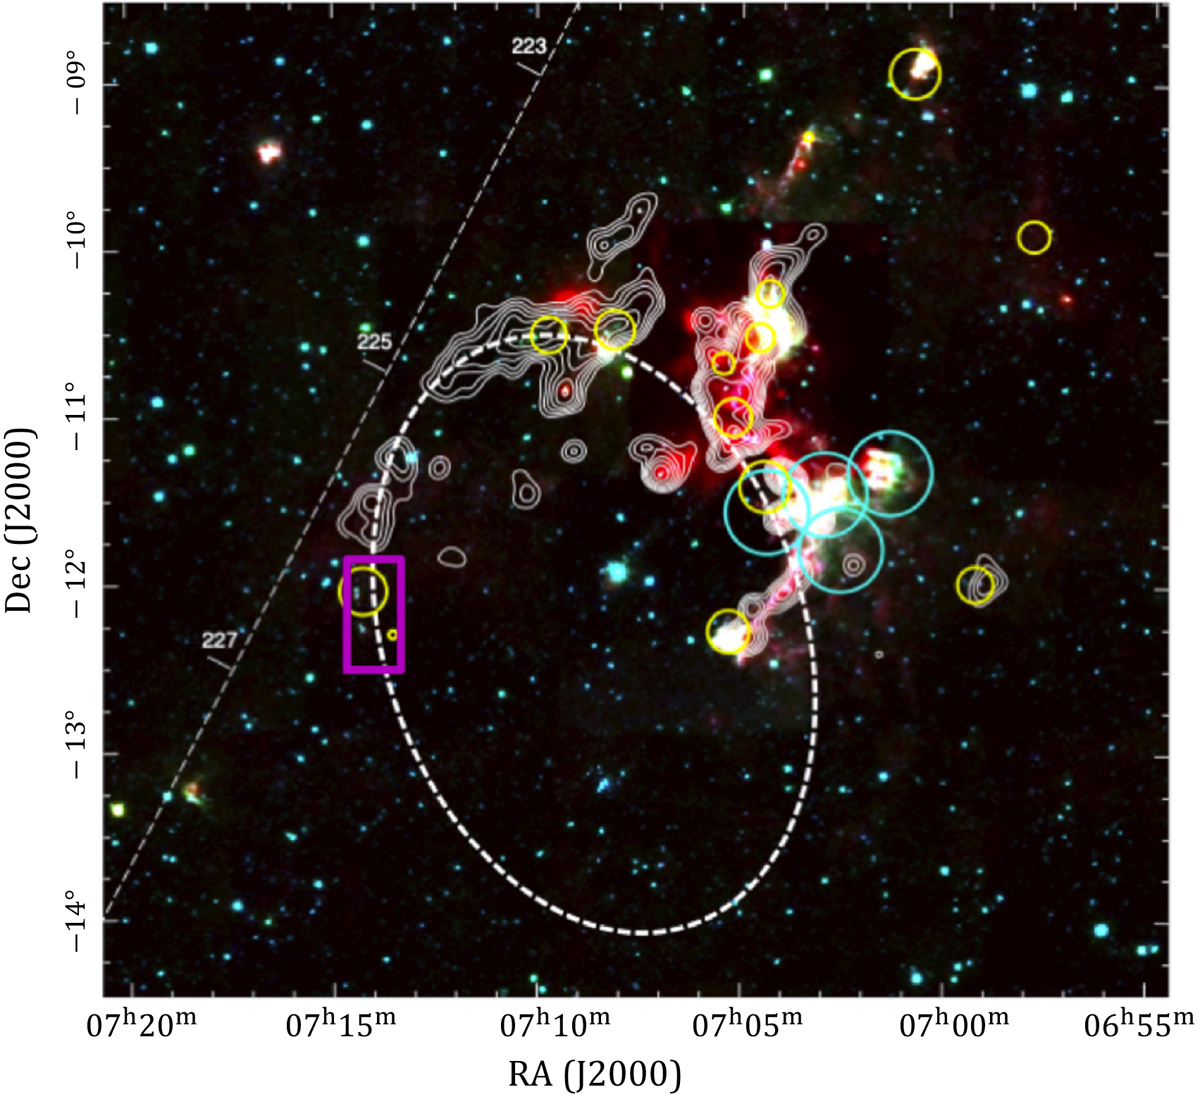
Fig. 1
Download original image
Overview of the CMa R1 region. Background is a RGB composite WISE image (red: 22.2 μm, green: 12.1 μm, blue: 3.4 μm). The dashed straight line gives longitudes in the Galactic plane and the dashed ellipse shows the area of the CMa shell suggested by Fernandes et al. (2019). White contours trace the molecular gas (13 CO). X-ray observations with XMM-Newton (Santos-Silva et al. 2018) are indicated by cyan circles, and the groups of YSOs studied by Fischer et al. (2016) are shown as yellow circles. The area studied here is marked by the magenta box. The figure is adapted from Fernandes et al. (2019).
Current usage metrics show cumulative count of Article Views (full-text article views including HTML views, PDF and ePub downloads, according to the available data) and Abstracts Views on Vision4Press platform.
Data correspond to usage on the plateform after 2015. The current usage metrics is available 48-96 hours after online publication and is updated daily on week days.
Initial download of the metrics may take a while.