Free Access
Fig. 5.
Download original image
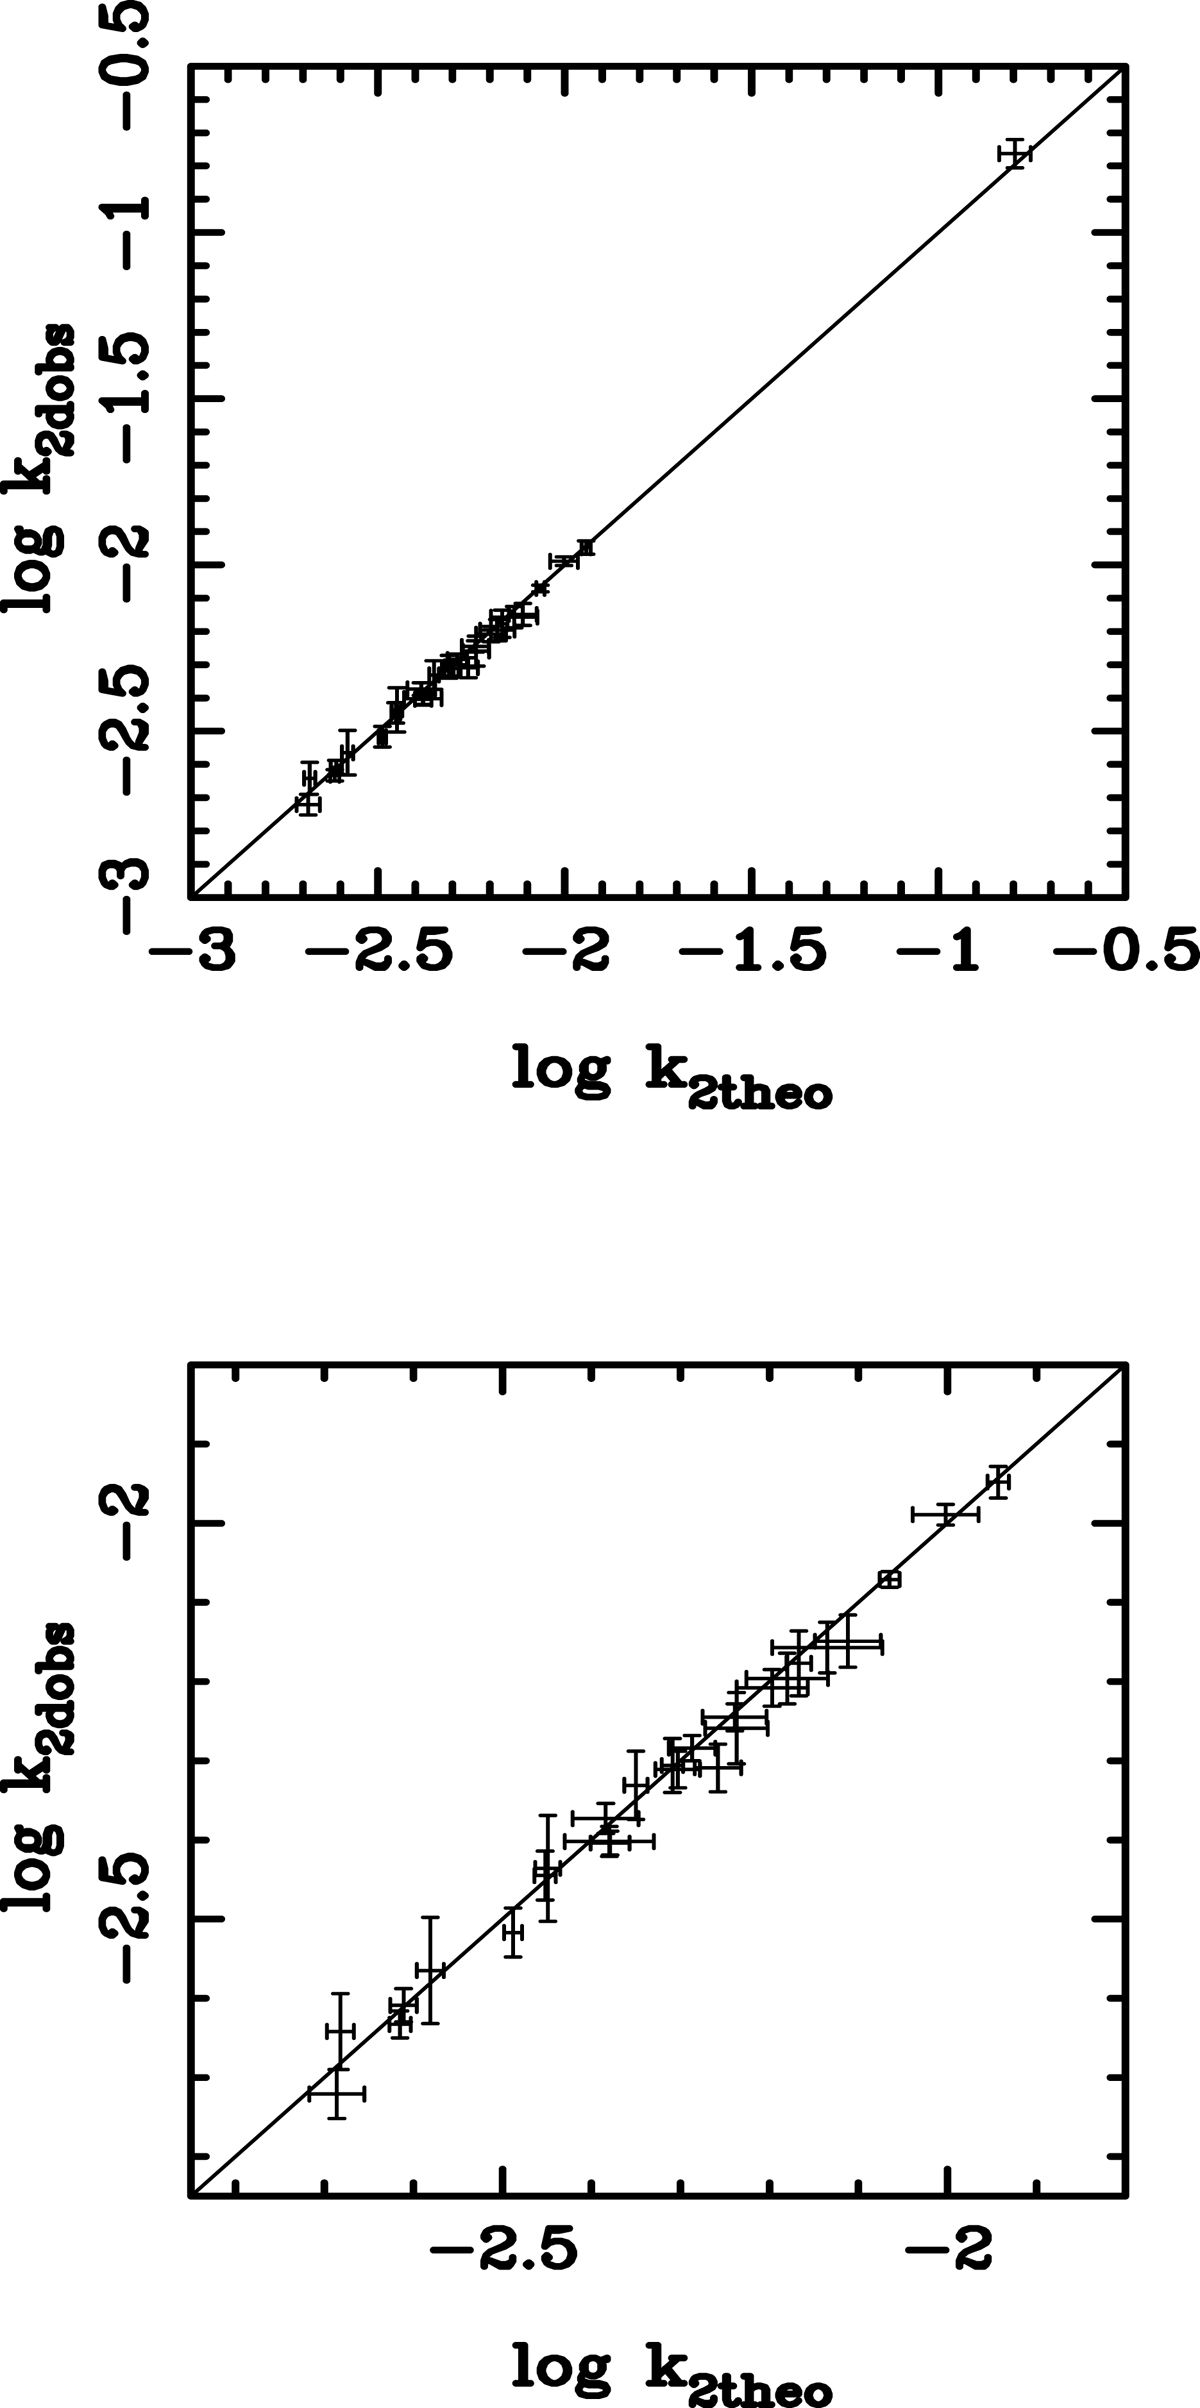
Top panel: a comparison between the theoretical predictions and the observed values of the apsidal motion constant log k2 for all systems in Table 3. Bottom panel: the same comparison but without plotting the low mass binary V530 Ori, which has a rather extreme value, so that the bulk of the sample can be better visualized.
Current usage metrics show cumulative count of Article Views (full-text article views including HTML views, PDF and ePub downloads, according to the available data) and Abstracts Views on Vision4Press platform.
Data correspond to usage on the plateform after 2015. The current usage metrics is available 48-96 hours after online publication and is updated daily on week days.
Initial download of the metrics may take a while.